Graphics Reference
In-Depth Information
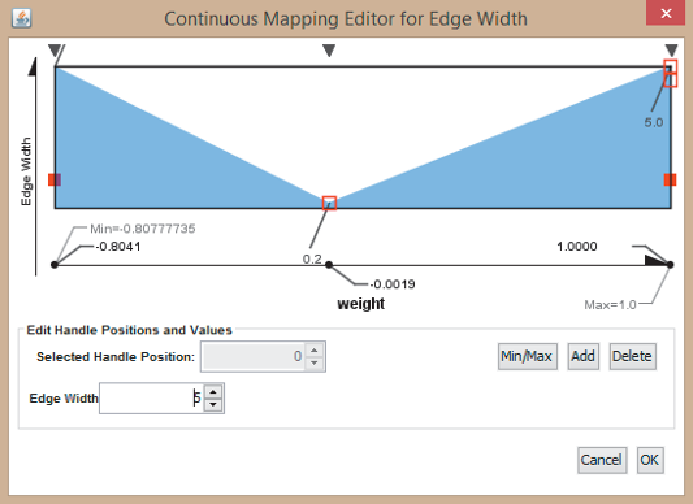
Figure 7-24:
The Continuous Mapping Editor in Cytoscape enables you to
change how the range of the data is applied to the range of the visual
attribute.
Similarly, you can adjust edge transparency or any other continuous
attribute at various levels.
Figure 7-25
shows the topic correlation graph
with the continuous mappings for edge color, edge transparency, and edge
width set, as shown in
Figure 7-26
.
Note how some highly correlated topics
may not be close together but are still highly visible because the thick green
connection remains visible over the other thinner, more transparent
connections (such as John McCain and Sarah Palin or Nancy Pelosi and
Claire McCaskill).