Graphics Reference
In-Depth Information
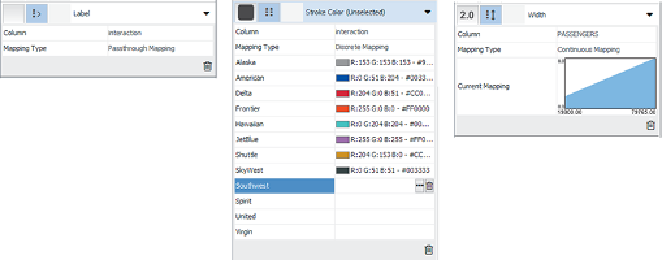
Figure 7-21:
You can configure visual attributes in Cytoscape.
2. Then, you must connect it to a column of data. The row labeled
“Column” will initially say “-- select value --”. Click the text “-- select
value --” and a drop down-menu will appear listing the data columns.
Pick one.
3. Finally, you must set a Mapping Type, also initially set to “-- select value
--”. You can choose from three types of mapping:
•
Passthrough
literally passes the value right through to the attribute.
This is appropriate for labels.
•
Discrete
enables each unique data value to be independently
connected to a unique variation of the visual attribute (for example,
unique shapes or unique colors). Use this for category data,
particularly when you have fewer than ten or so categories. Click
into the attribute field to set the attribute for that category. Any item
left blank gets the default property, set previously in the Defaults
section.
•
Continuous
transforms numeric data into a range of visual
attributes. Click the graphic to open the editor. You can create
multiple levels and set values at each level.
As an example of discrete mapping,
Figure 7-22
shows airline passenger
trafficdataforthetop500routesbetweenU.S.cities,and
Figure7-23
shows
the settings from the Visual Mapping Browser. The multiple links between
nodes are immediately apparent. For example, four different connections
between Honolulu and Los Angeles (HNL-to-LAX) are shown in the lower
left of
Figure 7-22
.
Using Edge Stroke Color, a unique color has been set per