Graphics Reference
In-Depth Information
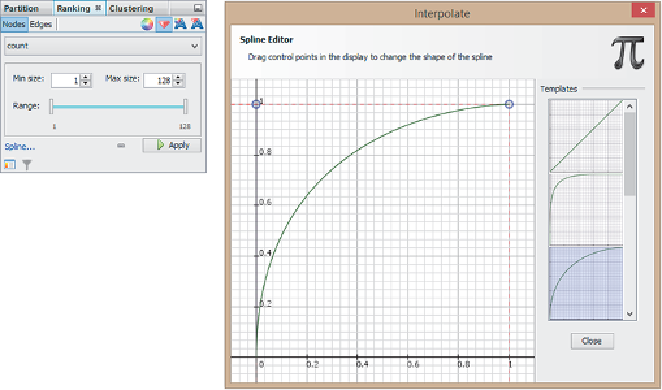
spread out the small values over a larger range and compress the high
values.
Figure 7-17:
In Gephi, when you are configuring a data value to a
visual attribute, you can configure the default linear interpolation with
the spline interpolator such as this curve, which is similar to a
square-root interpolation.
•
Identification
—Identifying nodes is a common task. In Gephi, you
can do this with either labels or the Edit panel. Given Gephi's quirky
interface, a few steps are required:
1. Turn labels on (using the first T button in the lower toolbar).
2. Scale the labels to a reasonable size (the second slider bar in lower
toolbar, as shown here).
3. Set the label size to a data value. The benefit here is that the smallest
labels can be made to disappear, thus reducing clutter and
improving readability. You set this via a drop-down menu in the
Ranking tab, with the Nodes sub-tab and the A-with-diamond icon,
as shown in
Figure 7-18
.