Graphics Reference
In-Depth Information
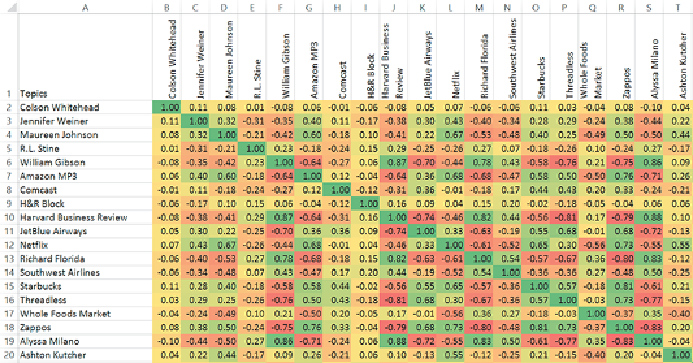
Figure 7-3:
This adjacency matrix in Excel shows trend correlations
between topics. Clusters are not visible.
For example, in this data set, youcan sort bothvertically and horizontally by
Harvard Business Review
(an influential business publication), as shown in
Figure 7-4
.
Although this shows items that correlate with
Harvard Business
Review
(as shown in
Figure 7-5
), only one other cluster is readily apparent
when zoomed out across the large data set of 80 topics.