Graphics Reference
In-Depth Information
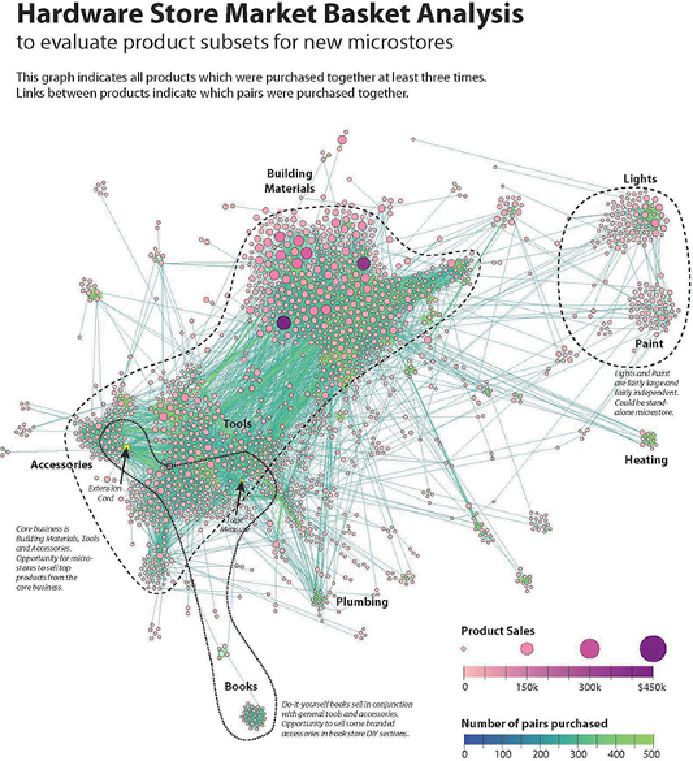
Figure 6-16:
This market basket analysis includes an explanation, legend,
and annotations. The graph was created in Gephi and exported as SVG, and
then additional information was added in Adobe Illustrator.
Figure 6-17
showsasimilar analysis withexplanation forthesame hardware
store market-based analysis, created using Cytoscape instead of Gephi. In
this example, a Cytoscape graph was exported to a .
png
image. The image
was inserted into PowerPoint with various text and outlines added. Since