Graphics Reference
In-Depth Information
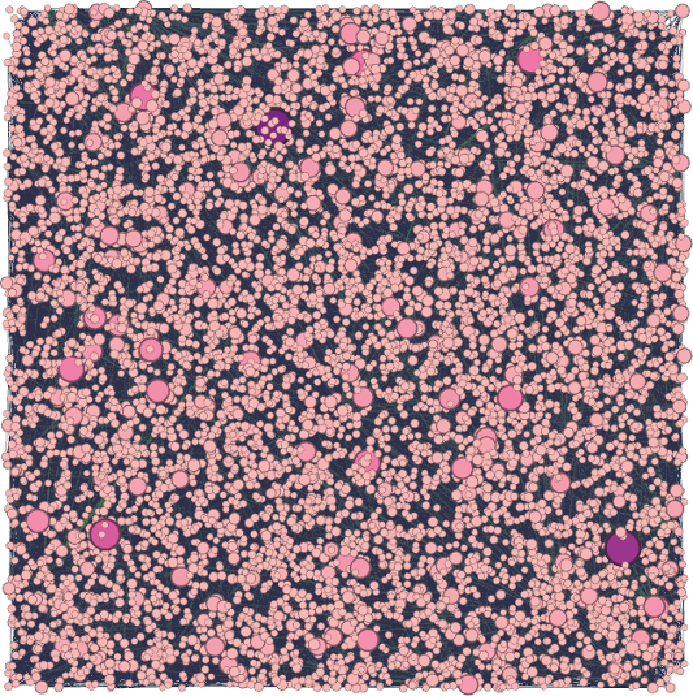
Figure 6-1:
This initial market basket graph looks like a square with
random node layouts.
On such a large graph, layout takes time. In
Figure 6-2
,
the layout has
been done using a Yifan Hu multi-level layout in Gephi and required
approximately 5 minutes to compute. The visual results indicate a
disconnected graph with one very big component, a few very small
components, and a number of isolated dots. The isolated dots are simply
individual products that were purchased with no other products. Examples
of some of these individual product purchases include specialized tools or
parts.