Graphics Reference
In-Depth Information
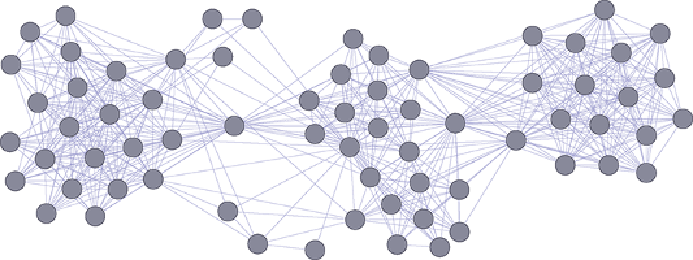
Figure 5-1:
In this graph of e-mails among family, the graph shows three
clusters but doesn't reveal additional details such as the number of e-mails,
the size of e-mails, and who the people are.
The graph without any sizes, colors, or labels only reveals three clusters in
the family and hints that a few people act as bridges between these clusters.
But who are these people? Who sends the most e-mails? Who connects the
different groups? What's different between these clusters? These are the
sorts of questions best answered by adding visual attributes to the graph.
Essential Visual Attributes
Table 5-1
shows a few basic visual attributes that are effective in almost
every graph for showing additional data attributes or graph statistics.