Geography Reference
In-Depth Information
Look at the attribute tables of each of the three raster datasets. What are the numbers you find
for Value and Count?
Values
Counts
Roads_rr2m
________________
________________
Sewers_rr2
________________
________________
Streams_rr2m
________________
________________
Buffering with Spatial Analyst (Maybe)
Recall that the site for the Wildcat_Boat facility has to be within 300 meters of a sewer line, and the site
must be at least 20 meters away from any stream. Both the sewer lines and the streams are represented
in raster by square cells that are 2 meters on a side, connected either at a side or a corner. To make a
raster-style buffer representation of these linear entries, we need to fatten up the zones. There is a Spatial
Analyst tool, Expand, which is reputed to be the raster equivalent of the vector procedure Buffer. You can
find it at ArcToolbox > Spatial Analyst Tools > Generalization.
The problem with Expand is that it adds on the number of cells regardless of whether they touch side to
side or corner to corner. If they touch side to side, and you have specified a cell size of 2 meters, you get
2 meters, on each side. If they touch corner to corner, however, as they would when buffering a diagonal
line, the increment is about 2.828 meters (the length of the diagonal of the square which is twice the
square root of 2). So, the moral of this story is that Expand is not a good equivalent for making a buffer.
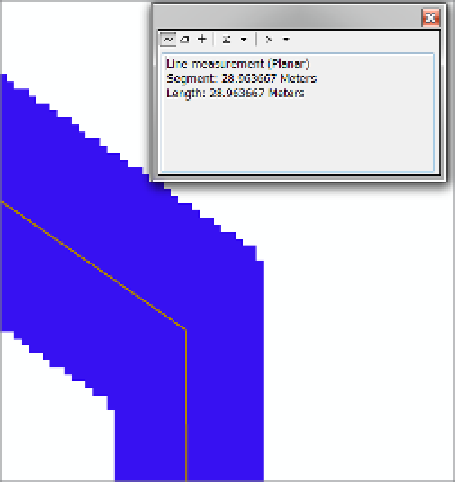
You can expand the width of Streams_rr2m by 10 cells to verify this fact. You'll find that when a line runs
horizontally or vertically, the distance from the center of the stream to the edge of the raster zone is about
21 meters. When the line is diagonal, the “buffer” is more like 29 meters. Please see Figure 8-41, noting
the difference in “buffer” width between the diagonal line and the vertical line.
FIGURE 8-41


Search WWH ::

Custom Search