Geography Reference
In-Depth Information
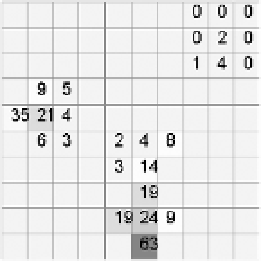
FIGURE 8-27
Accumulations of water,
based on elevations and
flow directions of the two
previous figures
The largest accumulation is in the south, which had the lowest elevation. Another point of considerable
accumulation is in the middle of the western side. If you look at the flow raster and the accumulation
raster, you can get an idea of where and why the stream channels developed.
Note that some cells have the value 0, indicating that no cells are uphill of them. According to the model
the Value of a cell is what flows into it from another cell; the rain that falls on a cell does not affect its
Value. Note also that most of the cells accumulate very little water, but some accumulate a great deal
of it—just as you might expect, since most of the land around us is uncovered by water, but there are
numerous creeks and streams. Finally, if you add up the values of the southern and western pour points
(63 and 35), you get 98. This makes sense, since of the 100 cells total, 98 of them are above the two pour
points.
Nonuniform Rainfall
The raster in the figure was developed without an input weight raster. It was assumed, therefore, that
each, received the same amount of rain and was presumed to receive the same amount of water.
You can change that by specifying a number for each cell in the study area. Consider an input weight
raster that looks like Figure 8-28. This weight raster represents a gradation in rainfall, which was heaviest
in the north.
If you consider that this was a rainfall event, and that the values in the raster cells, which vary from
almost nothing to more than 1.5, constitute inches of rainfall, you can see that much more rain fell in the
north than in the south across the study area. The total amount of rainfall is approximately the same as in
the previous example, but in that case the rainfall was distributed uniformly.
Now you can apply the Flow Accumulation calculation with this weight raster. The results, shown in
Figure 8-29, indicate that considerably more water volume showed up at the western pour point than
before, because the rain was lighter in the south. In fact, with the weight raster, about as much water
flows west as south. Recall that with no weight raster, almost twice as much flowed south as west.
This raster is the result of applying the Flow Accumulation calculation using the previous weight raster.


Search WWH ::

Custom Search