Geography Reference
In-Depth Information
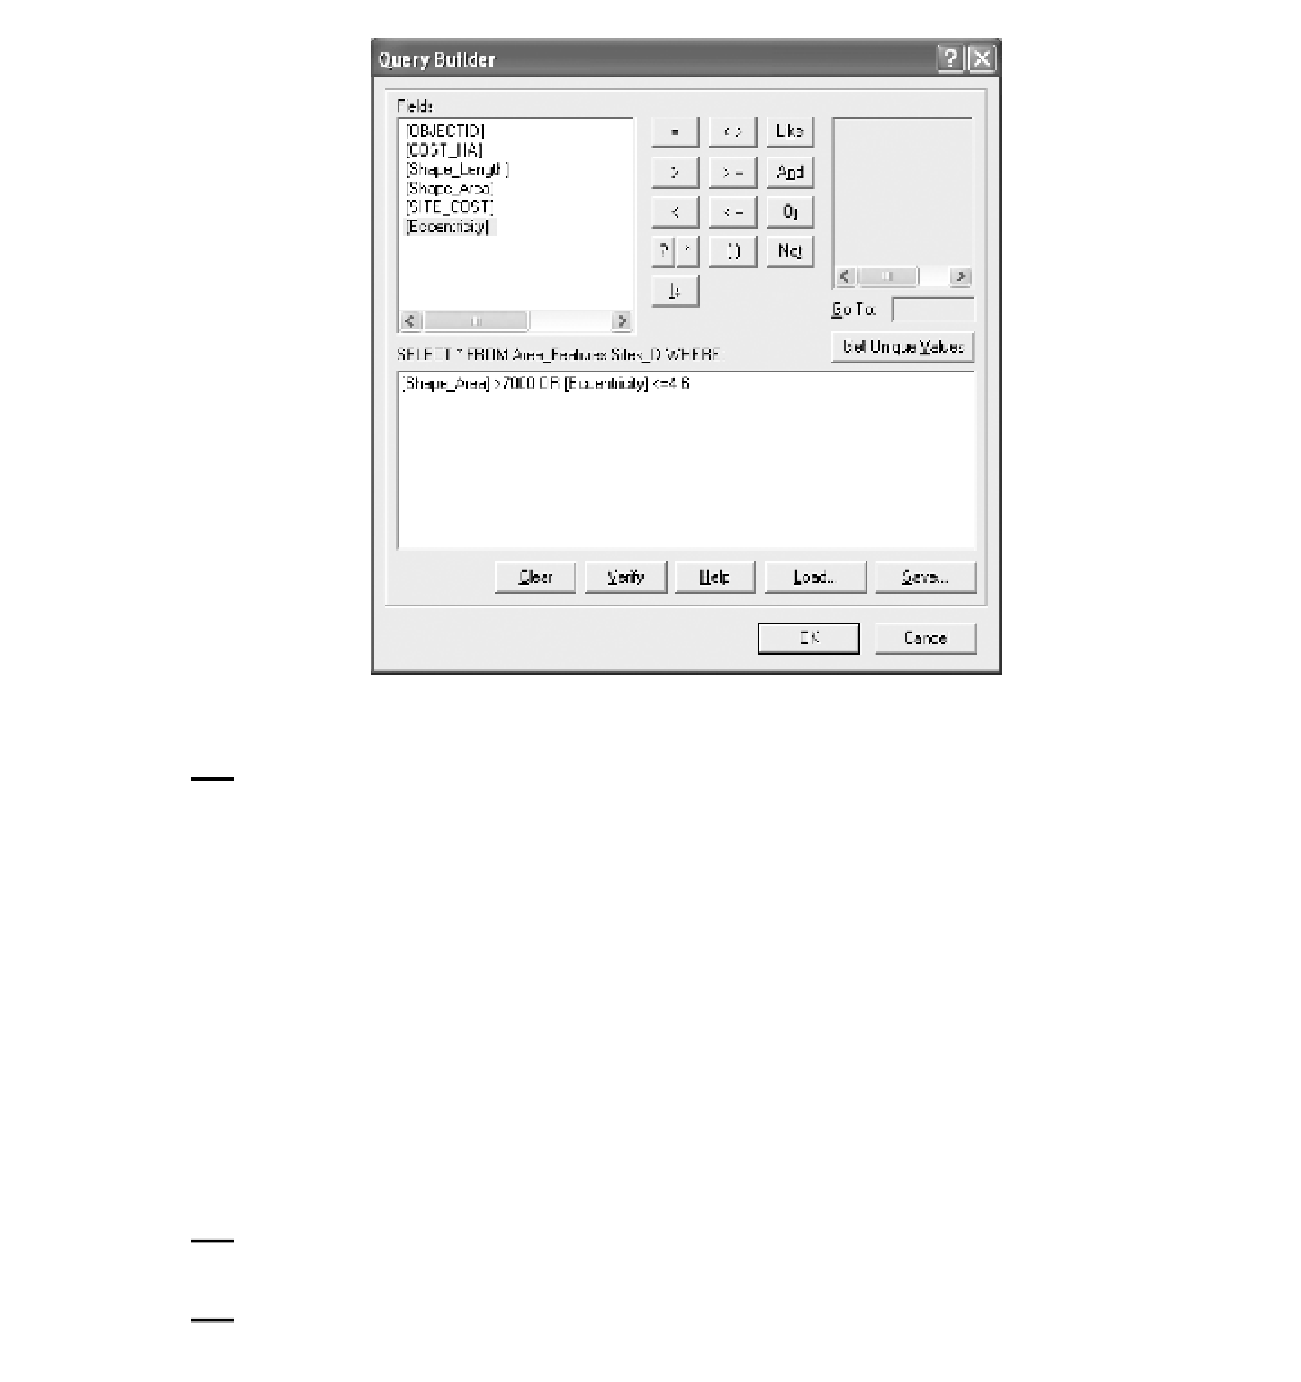
FIGURE 7-26 Size and Eccentricity selection
13.
Display Final_NEW_Sites, showing the sites in bright yellow. Provide graphic data from the other
data sources to show the relative location of the sites. Show the following:
The sewers in black, width 3
❏
The streams in dark blue, width 2
❏
The outline of the sewers buffer emphasized in red, width 3
❏
The streams buffer in light blue
❏
The polygons of land cover, with land cover code 300, emphasized and others in subdued
colors (except make code 500 dark blue, since it is water). See Figure 7-27.
❏
Save the map with whatever name you want. Now, using the features above, except for land
cover, display
❏
The polygons of soils, with suitabilities 2 and 3 emphasized and the others in subdued
colors. Save this map as well.
❏
15.
Zoom in on the group of sites. With the Identify tool, examine the resulting map to assure
yourself that the criteria have been met.
16.
Make a layout of the map. Print the layout, using a color printer if possible. Close any open
ArcGIS programs.


Search WWH ::

Custom Search