Geography Reference
In-Depth Information
37.
Suppose that you want the cost per hectare shown instead. Bring up the Layer Properties
window, and click the Symbology tab. In the Value Field drop-down menu, pick COST_HA. Add
All Values. Click Apply, then OK. The map colors have changed, but the labels remain the same.
So, go into properties again and select the Labels tab. In the Text String Label Field box, select
COST_HA. Click Apply, then OK. The cost figures appear.
38.
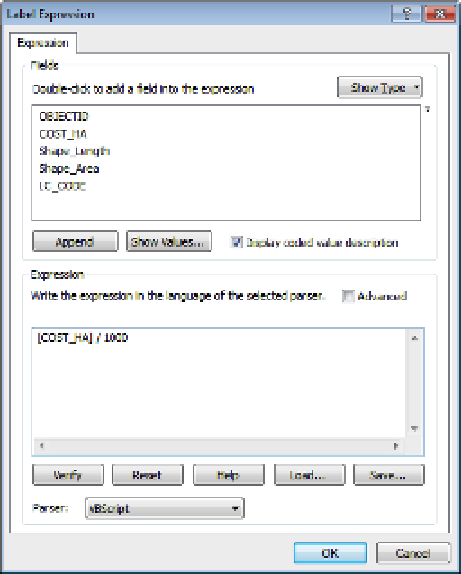
The numbers are a bit too big for the map. You don't need all those zeros. In the Layer
Properties window, Labels tab, click Expression. In the Label Expression window, add / 1000 to
[COST_HA]. The window should look like Figure 6-13. When executed, this expression will cause
each label value on the map to be divided by one thousand.
FIGURE 6-13
Click OK, Apply, and OK. Now only two-digit numbers should appear in the polygons.
39.
Change the color symbology for a subset of features:
The Land cover code 500 is for water.
Water in large quantities is usually blue. Change the field on which to base the Symbology of
the Landcover layer back to LC-CODE. (Note that to change the label field back to LC-CODE you
have to put [LC-CODE] by itself in the expression text box.)
Display the map with random colors as before. In the T/C, right-click the color rectangle next to
500. Pick a blue from the color pallet that shows up. Note the effect on the map.


Search WWH ::

Custom Search