Geography Reference
In-Depth Information
Standard Deviation
The formula for standard deviation is shown in Figure 6-10.
∑
X
)
2
(
X
2
n
2
1
FIGURE 6-10 Formula for standard deviation
The formula says this: (1) Find the average (that's x-bar, from Figure 6-8), (2) make a new set of
numbers by subtracting that average from each of the numbers in the original set, (3) make a third
set of numbers by squaring each of those in the second set, (4) add up this third set, (5) divide the
sum by n - 1, and (6) take the square root.
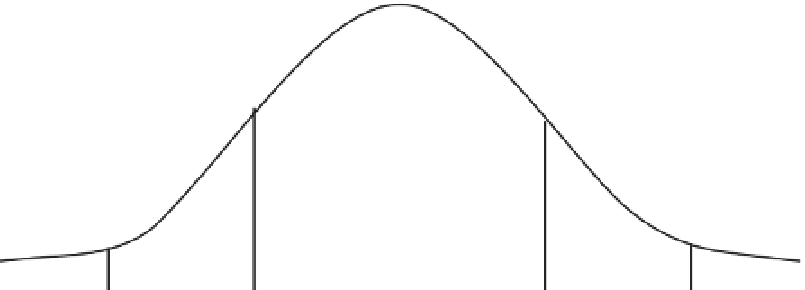
If the data are normally distributed—as, for example, the heights of adult men in a town might be—then
the standard deviation has a graphical meaning as well as a numerical one. Suppose Figure 6-11 is the
curve for the heights, with each height rounded off to the nearest inch.
The x-axis direction represents the possible heights and the y-axis direction represents the number
of individuals who have each given height. The curve is “bell shaped about the mean”; the mean is
65 inches. Graphically, the standard deviation is defined by the
x
values on the curve at its points of
inflection—where the curve goes from being cupped down to being cupped up. The standard deviation
is 4 inches. This means that approximately 68 percent of the individuals are between 61 inches tall (65 - 4)
and 69 inches tall (65 + 4) The idea behind the standard deviation is to give you an idea of how spread
out your data values are. The standard deviation is meaningful, but only if the data are close to a normal
distribution are you able to make statements like: 47 percent (34 percent + 13 percent) of the individuals
are between 65 inches and 73 inches tall (65+4+4).
Mean
Point of inlection
(from
to
)
13.6%
34.1%
34.1%
13.6%
69”
73”
57”
61”
65”
Two standard
deviations (8”)
One standard
deviation (4”)
FIGURE 6-11 Curve of normally distributed data values


Search WWH ::

Custom Search