Geography Reference
In-Depth Information
you will find the following:
A personal geodatabase named Feat_Num.mdb containing three feature classes:
feat_num_pts, feat_num_lns, feat_num_ply
Three coverages:
feat_num_pts, feat_num_lns, feat_num_ply
Three shapefiles:
feat_num_pts, feat_num_lns, feat_num_ply
The datasets are identical in what they represent. Each dataset contains three features: one of points,
one of lines, and one of polygons. (The personal geodatabase feature classes were converted from
coverages, as were the shapefiles.) What we will do is look at the differences in the tables. In particular,
we will look for differences in the FEATure NUMbers and at anomalies in calculation.
2.
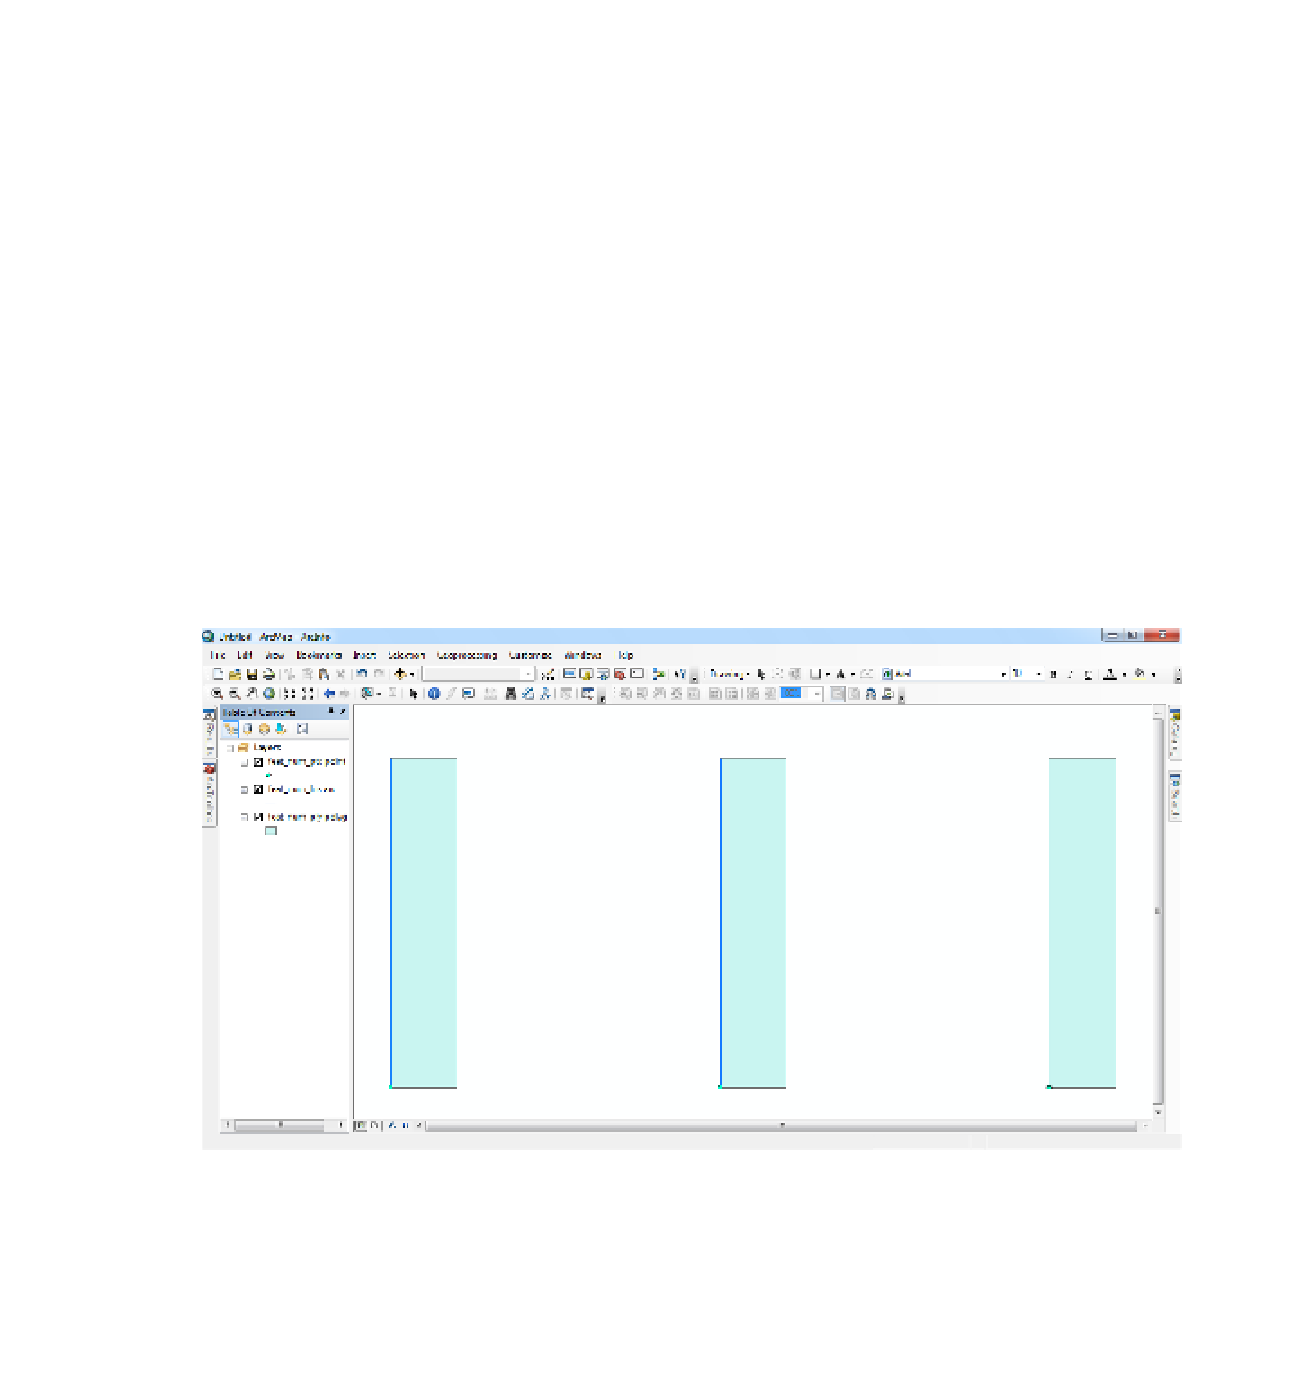
Add the appropriate components of all three of the coverages to ArcMap. You will see three
points, three lines, and three polygons. The map should look something like Figure 4-22.
FIGURE 4-22
Open, and leave open, the attribute table of each layer. They may pile up all in the same space, making a
tabbed label group, perhaps on top of the T/C. Move the table off the T/C if it is there. You can separate
them by clicking on Table Options and choosing Arrange Tables > New Horizontal Tab Group. (You might
have to do this twice.) If they are still jammed up together, drag the Table header up toward the top of


Search WWH ::

Custom Search