Geography Reference
In-Depth Information
45.
Display the map at 100 percent of the size it would appear on a page. Use the scroll bars, look
around the map to see that things are about the right size. Title the map with your name. Using
File > Print, print the map. Save it in the Map_Making folder as Sewers_Specs.mxd.
Charts and Graphs
Another form of communication—neither text nor map—can also be created by ArcMap: the chart or
graph. The software is capable of producing graphs and charts of both two- and three-dimensional
appearance.
46.
In ArcMap Click File > New. Select Letter (ANSI A) Portrait. Switch to Data View. Add the
personal geodatabase feature class named Soils from
___IGIS-Arc_
YourInitials
\Wildcat_Boat_Data\ … you know the drill.
Once the map has appeared in the window, symbolize the SUIT categories using Unique values.
47.
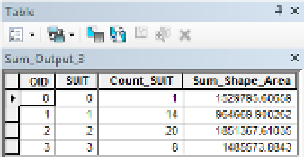
Open the Soils attribute table and summarize the suitability (SUIT) column, including the sum
from Shape_Area. Accept the default name and save it in Wildcat_Boat.mdb. Agree to add the
table to the T/C of the map. Dismiss the Soils attribute table. Open the Sum_Output_x table. It
should look about like Figure 3-15.
FIGURE 3-15
48.
Select View > Graphs > Create Graph to bring up the Create Graph Wizard. Click the drop-
down menu of Graph type, and look at the many types of graphs you can create. Pick Vertical
Bar. In the Layer/Table field choose Sum_Output_x (x is some digit, depending on how many
tables you have created in this session). For the Value field, you will want Sum_Shape_Area.
Make the “X field” SUIT. Uncheck Add to legend. For the Color use Pallet (Excel). Leave the
rest of the options at their default values. Click Next. Change the title to “Square Meters of
Soil Suitabilities”. In Axis properties make sure the Visible boxes of the Left and Bottom axes
are checked. Give the Left axis the title “Totals of Areas”; use the title “Suitabilities” on the
Bottom axis. Both Right and Top should be blank. The axis titles will appear on the graph.
Click Finish.
49.
A Graph should appear. Make it taller and narrower. Slide it over on top of the Sum_Output_x
table so you could get to either table by clicking on its header.
50.
Assuming that the graph looks as it should (see Figure 3-16) slide your cursor to it.


Search WWH ::

Custom Search