Geography Reference
In-Depth Information
3.
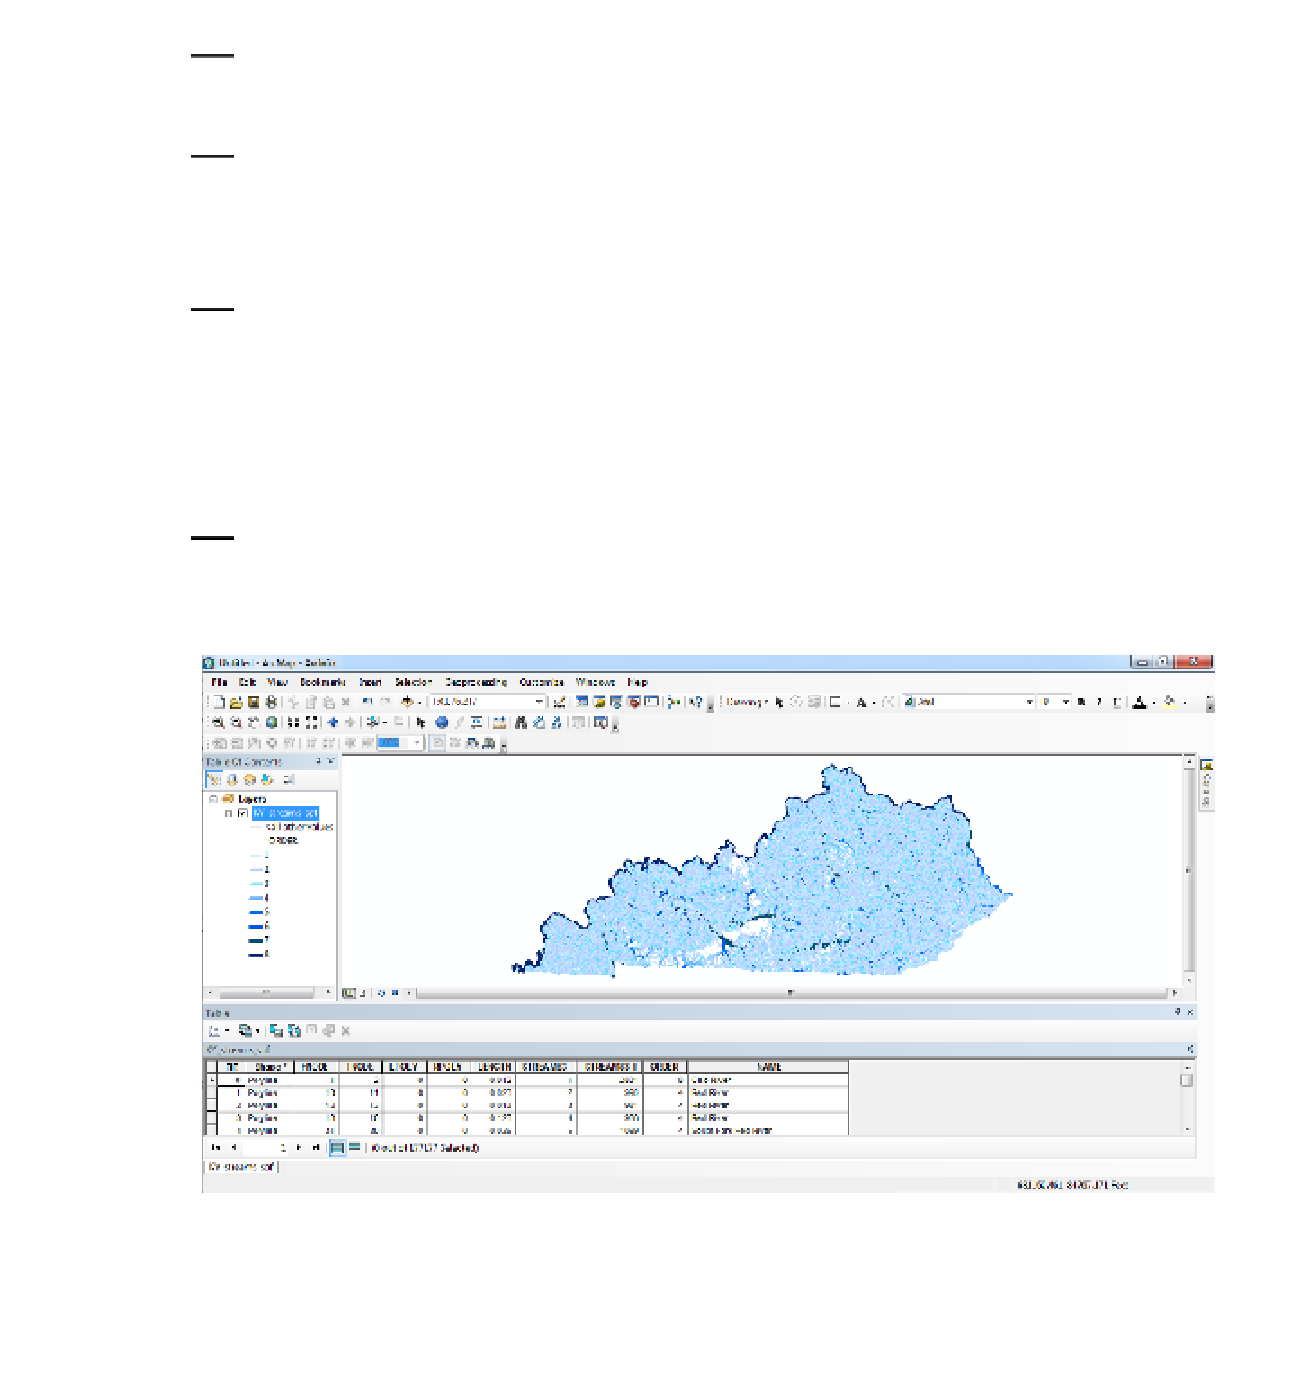
Open the KY_Streams_spf attribute table. Dock it at the bottom if it is still at the side to make
it easier to read while docked. Shorten it vertically and zoom the image to Full Extent. How
many stream segments are there? _____________.
4.
All the KY_Streams_spf are shown with a single color.
14
Suppose that you want to see the
smaller streams in a lighter blue and the larger ones in a darker color. The attribute table has
a column labeled ORDER_, which has values from 1 to 8. So, let's change the way the streams
are drawn: Right-click the shapefile name in the T/C, then click Properties > Symbology >
Categories > Unique Values. In the Value field, select ORDER_, then click Add All Values.
5.
Double-click the symbol for Order 1 streams. Pick the color Sodalite Blue with a width of 1 to
symbolize this stream. For Orders 2 through 8, use width values of 1.33, 1.67, 2, 2.33, 2.67,
3, and 3.33, respectively. Pick colors of blue that are darker for higher orders, ending with Dark
Navy for order 8. Click Apply. Click OK. The result will look something like Figure 3-12.
You probably noticed that it took some time and concentration to symbolize the map in this way. Should
you remove KY_Streams_spf from the T/C, all that work would be lost. A layer file (extension LYR) will
preserve the symbology.
6.
Right-click the name KY_Streams_spf and select Save As Layer File from the menu. Place KY_
Streams_spf.lyr in
___IGIS-Arc_
YourInitials
\Map_Making.
FIGURE 3-12
14
You might think, looking at Kentucky streams, that there is a “U” shaped swath of missing data. Not so. There just
aren't any streams there, because of the karst geological formations. Rainwater water soaks in rather than running
along the surface. There are some Kentucky roads on which you can drive many miles without crossing a bridge.


Search WWH ::

Custom Search