Geography Reference
In-Depth Information
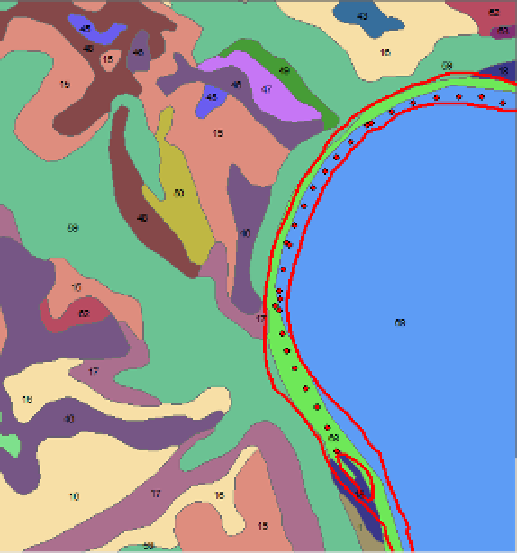
FIGURE 2-40
❏
Quantities
❏
Charts
❏
Multiple attributes
Pick Categories, and within that, Unique Values. This setting will ensure that when you leave
this window the software will assign a color to each polygon depending on the value of a field in
the attribute table. For the Value Field select MINOR1. For the Color Ramp choose one that has
strongly different colors, say Basic Random. Click the Add All Values button. Click Apply, then
OK. See Figure 2-40.
7.
In this step, turn on other layers as needed. Determine the MINOR1 value of the soil
type classification (1) of the island, _______, (2) near the stream that flows southeast into
the river, _______, (3) that is used to indicate water, ______, and (4) for areas not in Fayette
County ______. Use the Identify tool to verify your answers. Also check that the color used for
the island polygon corresponds to the color next to its number in the Layer pane (in the T/C)—
you will have to scroll down to see the values and associated colors. Collapse the list of colors
by clicking the minus sign next to cole_soil_polygon. Turn off cole_soil_polygon.
Some Geological Data
8.
Also in the Quadrangle_Data feature dataset you will find cole_rock_polygon, which shows the
classification of the surface geology. Add it as a polygon layer, just as you previously added the
soils feature class.


Search WWH ::

Custom Search