Geography Reference
In-Depth Information
3.
Zoom back to River Bend. To get a better idea of the changes in elevation, pick a
monochromatic color ramp—say, Yellow to Green to Dark Blue—by selecting COLE_TIN's
Properties, the Symbology Tab, and making a checkmark next to Elevation in the Show area.
Right-click Color Ramp, unselect Graphic View, scroll to the desired ramp, and click it. Then,
using Classify, pick Defined Interval as a method and 25 as the interval size. Press OK. Make
sure the box next to “Show hillshade illumination effect in 2D display” is checked. (This
produces a neat presentation that lets you see the individual triangles.) Click Apply, then OK.
See Figure 2-35.
FIGURE 2-35
4.
Use the Identify tool to notice that, with a TIN, the elevations are calculated rather than
stored in an attribute table:
Zoom in so that you can view a dozen triangles or so in the
southeast corner. In the Identify window, set “Identify from” to COLE_TIN. Pick a triangle and
get the elevations close to its vertices. Since the triangle is tipped, you will get different values
for Elevation when you use Identify. MapTips will show you the value of the elevation of the
underlying DEM. Now pick a vertex where three or more triangles come together, and get the
elevations of the adjacent corners of those neighboring triangles. Those values should be about
the same, since the vertex has a single elevation.
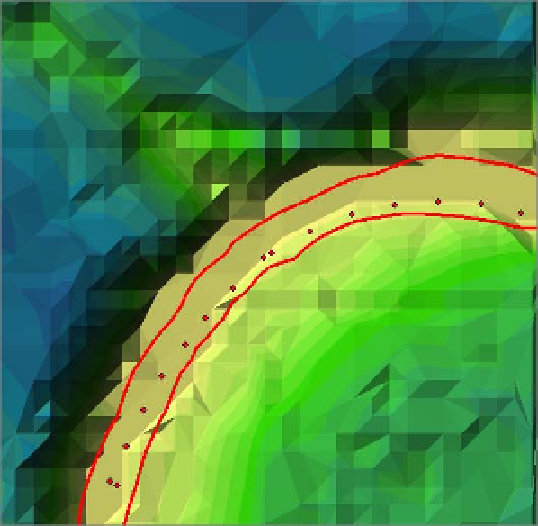
5.
The Identify tool also presents the slope of the triangle (in degrees) and the aspect
(the direction in compass degrees that the face of the triangle is inclined towards). In
Figure 2-36 the particular triangle identified has a slope of about 17 degrees and an
aspect of approximately southeast. As illustrated shortly, you may also view the TIN at
oblique angles, rather than from simply directly above. You could spend a full day exploring
the different ways to display TINs. Come back to this if you are interested. Get guidance
from the ArcGIS Help files.


Search WWH ::

Custom Search