Geography Reference
In-Depth Information
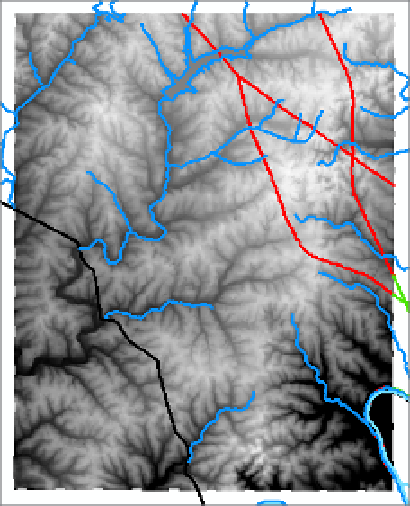
FIGURE 2-31
T/C? _____ feet to ______ feet. Drag its title to the bottom of the T/C. Turn off the two image
layers above it. Zoom to the extent of the DEM layer. You can get an idea of the topography by
looking at the DEM. White areas are the highest elevations; dark areas the lowest. See Figure
2-31. Select the Identify tool on the Tools toolbar. Click a light area that doesn't have other
features (such as vectors) nearby. The Identify window will show the elevation in two places:
under cole_dem and as the Pixel value. (You will also see a stretched value number, which
should be close to 255. This indicates the intensity of the “color” at that location. Pure white
would be 255 which corresponds to a byte with all bits set to 1s, that is, 2 to the 8th power.)
Set the “Identify from” text box to COLE_DEM (scrolling the drop-down menu as necessary) so
that you no longer have to avoid other features when clicking on the DEM. Dock the Identify
window to the left of the screen, next to the T/C. Shrink its horizontal size; again zoom to the
extent of the DEM. Now use the Identify tool on a dark area. Here the stretched value should
be near zero. Click on the DEM at the river. Record the Pixel value, representing the elevation,
here: _______.
40.
Zoom in on an area where there is a large variance in elevation. Zoom in some more. At some
point, you will see the individual pixels that make up the DEM. Now, with the display units set
to Feet, measure the pixel size to the nearest foot, by measuring across 10 pixels. __________
feet. This number, rounded to the nearest foot, is one of the standard cell sizes for DEMs.
41.
Zoom to the GPS track. Yes, the appearance of the DEM is unimpressive—mostly black, due to
the way the heights of the grid posts are classified. To fix this, right-click the DEM layer name in
the T/C and click Properties. Under the Symbology tab in the Layer Properties window, select
Classified in the Show area. Select a color ramp that goes from Yellow to Dark Red. You can do
this either by (1) looking at the actual color choices in the drop-down menu or (2) right-clicking
the Color Ramp bar and turning off the Graphic View, so that the drop-down menu shows you
text descriptions. When all this is set up, click Classify. Look at the Classification Statistics.


Search WWH ::

Custom Search