Agriculture Reference
In-Depth Information
(a)
0
10
20
30
40
50
60
70
Hours
(b)
Q10
3.0
2.0
1.5
0
1
2
3
4
5
Stdev of soil temperature
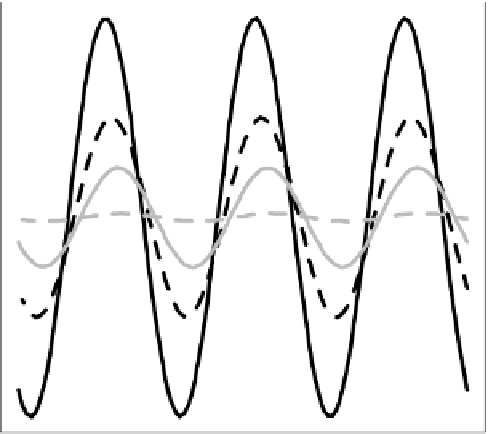
Figure 3.2
An illustration of how variance in biogeochemical controls (e.g., soil temperature) influ-
ences aggregation bias in the case of a simple monotonic nonlinear function. (a) Diel soil tempera-
ture oscillations over 3 days at four depths; 2 cm (solid black line), 10 cm (dashed black line), 20 cm
(solid gray line), and 100 cm (dashed gray line). In this example, the amplitude of the diel oscillation
decreased with soil depth, and the daily mean soil temperature was constant with depth. (b) A
numerical simulation of the influence of variance on aggregation bias with three levels of
Q
10
: 1.5,
2.0, and 3.0 (as redrawn from Ruel, J. J., and M. P. Ayres. 1999. Jensen's inequality predicts effects of
environmental variation.
Trends Ecol. Evol.
14:361-366). Here, the vertical lines correspond to those
from
Figure 3.2a
and represent the standard deviation of each soil temperature oscillation with
soil depth.


Search WWH ::

Custom Search