Information Technology Reference
In-Depth Information
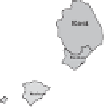
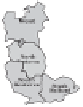
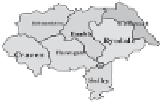
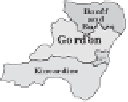
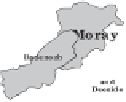
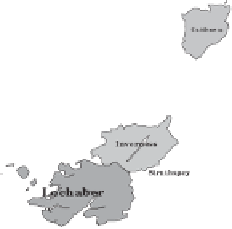
Local Government Districts
Annotated base map, shaded by
the 1981 unemployment rate.
5%
10%
15%
20%
25%
30%
35%
40%
45%
Figure 2.10 These are the 459 areas that local councils (elected by ward) gov-
erned. Spending was allocated by them and local taxes (the rates) collected. As
a result, these are also the units for which most accurate mid-year population
estimates were made. Many separate areas of high unemployment appear and the
Southern Scottish islands are now under the name of 'Argyll and Bute'.


Search WWH ::

Custom Search