Information Technology Reference
In-Depth Information
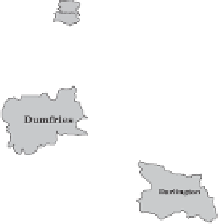
'Functional' Cities
Annotated base map, shaded by
the 1981 unemployment rate.
5%
10%
15%
20%
25%
30%
35%
40%
45%
Figure 2.7 These are amalgamations of local labour market areas drawn around
the 136 largest cities of the land, to include their spheres of influence. Notice
how suddenly Corby appears as an unemployment blackspot for the first time in
this series of maps, illustrating the effect of borderline decisions. Note how the
South-Western Isles of Scotland change to 'Greenock'.


Search WWH ::

Custom Search