Information Technology Reference
In-Depth Information
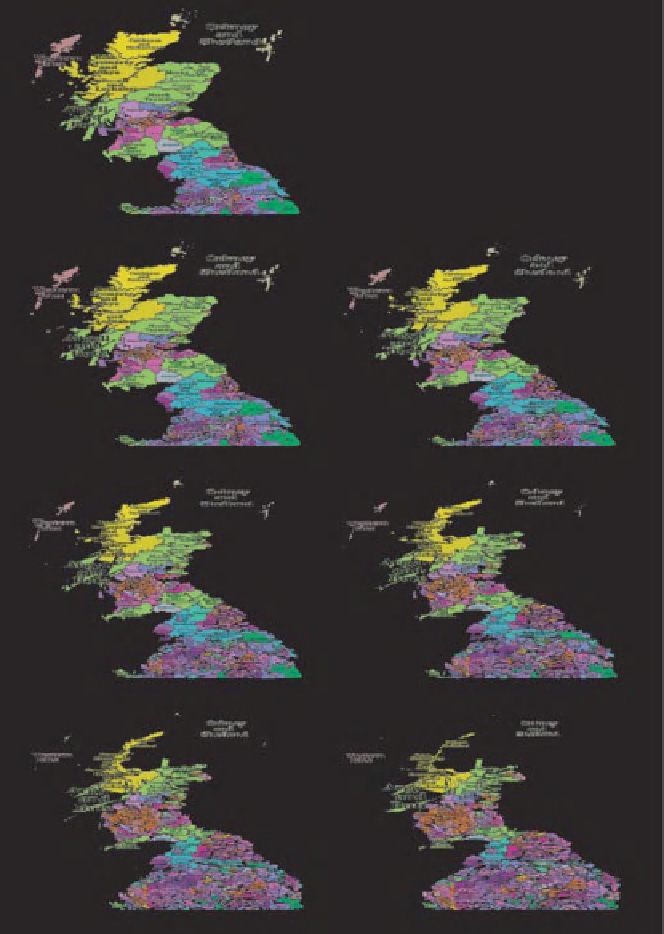
Transformation of the
Political Map of Northern
Britain to Population
Space
Constituencies coloured
by the proportions of the
vote cast in 1987, resized
in proportion to the
electorate.
Figure 10.3 Seven views of the progress of a computer animation that created
the Northern half of the previous figure. Notice how much the map changes from
green and blue domination to a cartogram of almost total red and purple and a
little yellow/green: the Liberal and Scottish National Party regions shrink, while
the Labour and Conservative/Labour battleground grows in proportion to voters.
Note: parts of original image were produced as a bit-map of pixels of colour not
as a vector graphics file of lines, curves and areas.
Search WWH ::

Custom Search