Information Technology Reference
In-Depth Information
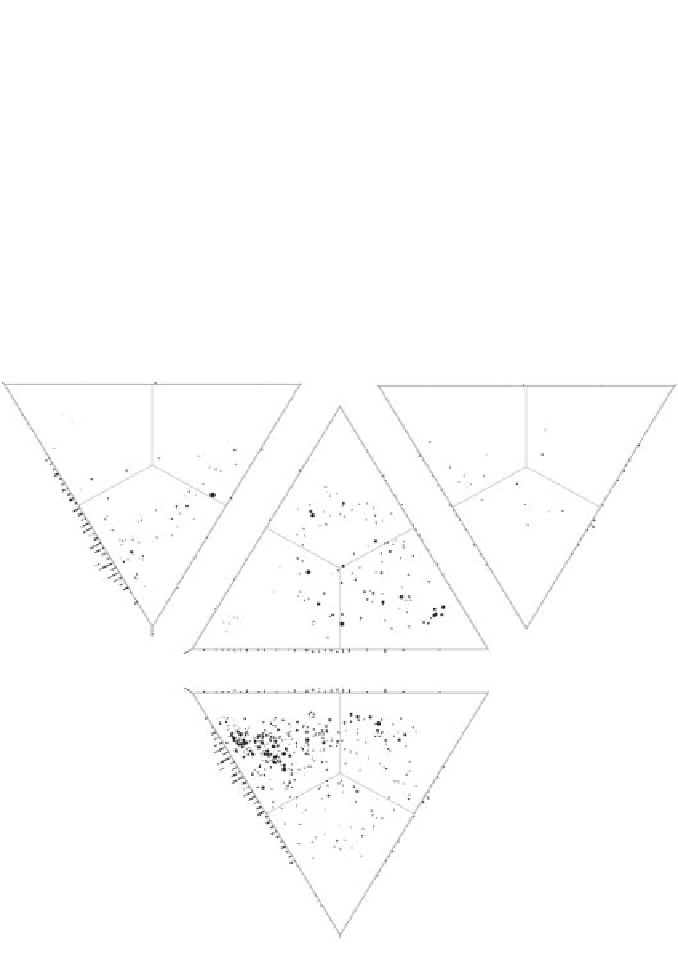
1988 District Elections: Scottish Voting Composition
The triangles show the projection of a regular tetrahedron encompassing
electoral ward competitions involving as many as four separate candidates.
Every ward won by one of the major parties is shown as a circle on the
diagram, its area in proportion to the total vote. The position of the circle
indicates the composition of votes in that ward. Circles are shown on the
side of the tetrahedron they lie closest to. Wards falling on the edges of the
tetrahedron are projected as histograms of two party support on the sides
of the triangles. Distance from each apex measures the support for a party
from total to none.
SNP
100%
Liberal/Alliance/SLD
SNP
100%
100%
Conservative
Labour
100%
100%
SNP
100%
Figure 9.16 Using the previous layout, every constituency result is shown here
on a three-party triangle, which ignores any party that came fourth or worse.
Two-party contests occur (twice each) on the sides of the triangles and each
uncontested seat (all then won by Labour) are at the three corners. The most
common three-party result was Labour first, SNP second, Conservatives third and
Liberals fourth.
Search WWH ::

Custom Search