Information Technology Reference
In-Depth Information
The Changing Distribution of Voting,
Housing, Employment and Industrial
Compositions in Constituencies
Between 1983 and 1987.
Relative Social Indicators
Decreasing
Increasing
% Services Employees
% Electorate Voting
% Adult Employment
£ Mean Housing Price
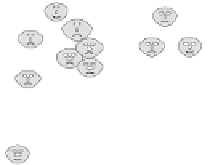
Facial features are in
proportion to the
changes in the social
and economic
characteristics
of the areas they
represent.
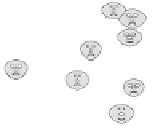
Figure 8.13 Look at the South and south east London; fat but miserable faces.
Was this distress caused by the loss of jobs there or gaining few? In contrast it is
happy days in the North and West despite shrinking faces. Who cares if your homes
are not rising much in value if you have work? In Scotland, south of Aberdeen,
more joy is coming. Expensive housing does not imply happiness.














Search WWH ::

Custom Search