Information Technology Reference
In-Depth Information
Box 8.2
Trees and pyramids
Two unusual glyphs are shown
in this topic. While appearing
very different they share a num-
ber of common traits, including
multiple variables.
The reflected pyramid
is a collection of bar charts
showing four closely related
distributions. Here, these are
of eight industries subdivided
by the proportions of male and
female, full-time and part-time
workers in each place. The area
of the symbol is proportional to
the number of employees. The
height of the bars gives the share
of workers in each industry
and the width shows how they
are spread among the different
categories of employment.
A similar use of height and
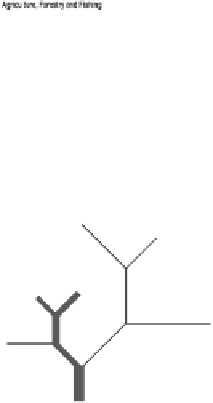
width is employed with the tree glyphs showing house price structure. Here
lengths are average prices and widths the number of sales in each sector,
giving area as total revenue. Now, however, the combined statistics of sub-
markets are shown in branches lower down the tree, the trunk giving the
total sales, average price and total revenue for the whole market. The angle
at which the branches divide has not been used here, but could be employed
to present yet more information.
Proportions of
Employees
in each
Industry.
Full
Time
1987
Proportions of
Residents in
each type of
Employment
Part
Time
The National Distribution
Male
Female
Detached or
Bungalow?
Yes
£50,824
No
Central
Heating?
No
1983
£34,565
Yes
£19,172
£24,750
Bathrooms >= 2
Detached or
Bungalow
£68,686
£36,884
Bedrooms < 4
Bedrooms >= 4
£28,839 national mean
All Sales in the Year
A fundamental difficulty remains. Bar charts, graphs and pyramids were orig-
inally designed to stand alone, and thus often contain enough complexity and
detail as single entities, becoming confusing in multiples. Glyphs, to be used
in a spatial context, must generalise and simplify the information if the overall
patterns are to be understood, particularly if more than a few dozen areas are to
be compared.
As the number of areas being visualized grows larger so too do the differences
to be seen between those areas. The industrial structure becomes less predictable
and the population structure more varied. Unfortunately, at the same time our
symbols get smaller and comparison becomes more difficult. We must design
simple glyphs that do not require a lot of space and that the eye can quickly
comprehend, without excessive examination.


Search WWH ::

Custom Search