Information Technology Reference
In-Depth Information
Industrial Classification
The Changing Detailed
National Composition of
Industry in Britain
by Employee Status
and Gender, 1984-1987.
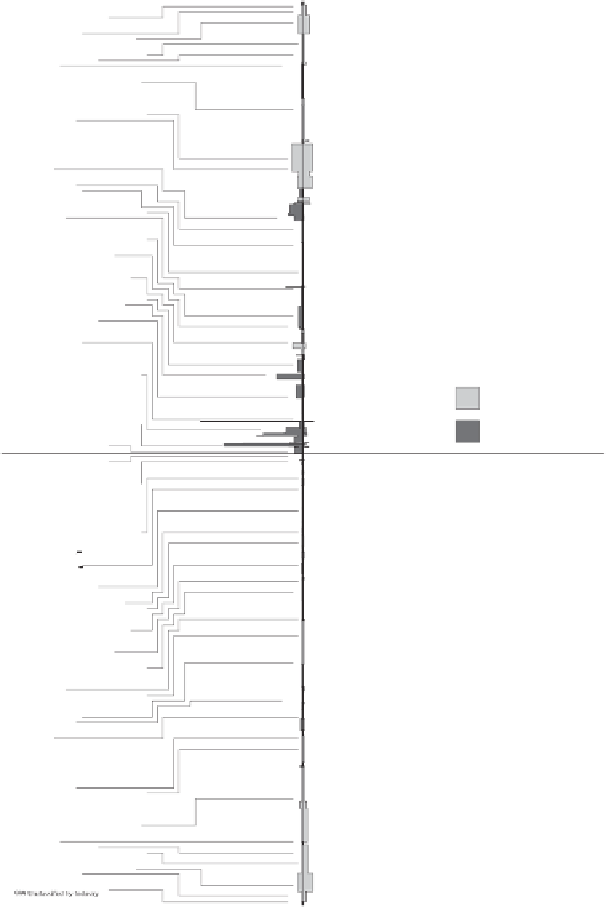
The chart shows the
change in number of
jobs between specific
industies, full time
and part time,
male and female.
Total Area = 425,154 jobs
Jobs gained
Male Full Time
Female
Full Time
Jobs lost
...... 25% ...... 50% ...... 75% ......100%
Proportion of jobs lost to the industry.
Male Part Time
Female Part Time
The area of the blocks
forming the chart is in
proportion to the number
employees gained or
lost in the industry.
The width of the bars shows
the overall share of jobs
between the industries,
the length of the bars
indicates each industry's
specific gender/status
bias.
Figure 8.4 The change shows a clear pattern, drawn here to the same scale as
the previous image. The loss of male full-time jobs in primary and manufacturing
industries is marked, especially in mining related areas. These falls were not offset
by the rises (roughly equal for both sexes) in the banking and insurance service
industries, especially as so many of the new jobs were part-time jobs.


Search WWH ::

Custom Search