Information Technology Reference
In-Depth Information
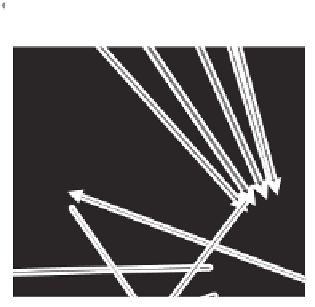
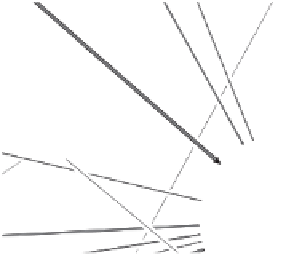
Box 6.3
Drawing overlapping arrows
This diagram shows how the sizes of
migration streams between two places
can be shown by a single arrow.
The arrowhead points in the direc-
tion of net flow, the size of the larger
flow being shown by the width of the
black line and the minor flow by the
width of the grey line placed within it.
A white border is placed around the
arrow to separate lines lying beneath
it and to clarify the image. The order
of the arrows is then as follows: flows
between neighbours are uppermost fol-
lowed by second, then third order contiguities. The inset shows part of the
country level migration structure north-west of London.
Firstly, the flows can be ordered; lines can be placed above and partly obscur-
ing other lines. This is achieved by drawing a slight white border around the lines.
The strongest flows could be uppermost, but it was found most advantageous to
put those that were between contiguous areas foremost, those of second order
next and so on. The effect of this is to clarify the image, hide the most obscure
deviance and show the most structure. Only strong unusual movements will show
through the mesh (Box 6.3).
Secondly, flows can only be drawn that represent more than a particular
type of average propensity to move.
9
The proportion of an area's population
travelling to another area to work must be greater than the national average
propensity for the line to be drawn. This usually means that over three-quarters
of those travelling are represented on the image and that these are the most
typical commuters.
10
This technique is particularly useful when flows between
9
'For all but the simplest networks these link data displays have many intersecting lines and
are difficult to interpret. There are several possibilities for reducing clutter. One is to shorten the
line segments, that is, instead of drawing the line segments 50 % of the way between nodes, draw
them 30 % or 10 %, say. Another is to draw only lines whose corresponding statistic falls above or
below some threshold. The difficulty with these ideas is that it is quite hard to come up with a good
heuristic for setting these thresholds or line lengths (or overall line thickness, for that matter) before
making the display' (Becker et al., 1990b, p. 93).
10
It is worth remembering that it is these flows that keep the static structure stable, not just
commuter flows maintaining cities, but migratory flows maintaining that nature of neighbourhoods.
Most flows reinforce, rather than change, the structure: 'Many movements of individuals in the
population do not alter the characteristics of the area, since one council tenant often replaces another,
and one stockbroker moves only to sell his house to another stockbroker and so on. Even where
an atypical individual arrives in an area, his new environment may influence him towards adopting


Search WWH ::

Custom Search