Information Technology Reference
In-Depth Information
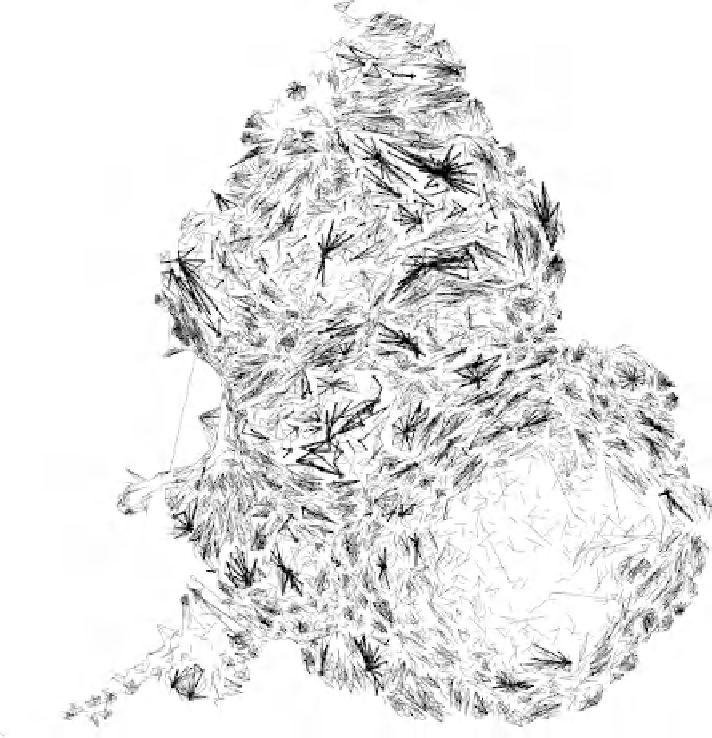
Daily Commuting Flows
Between English and
Welsh Wards in 1981.
The line width of flows involving more
than 1000 people is drawn in proportion
to the magnitude with direction indicated.
Flows of more than 1 in 20
31.7% of all movements shown
of the two area's participating
populations drawn as thin lines.
on a population cartogram.
Figure 6.8 On the cartogram the flows shown on the previous equal land area
map now form distinctive clusters, showing how each settlement is a separate
entity in space. The thicker lines give greater definition to particularly well-
focused urban centres. Lengths of lines here reflect commuting time more than
distance. Most flows out of and into London wards are too diffuse to show up.
Search WWH ::

Custom Search