Information Technology Reference
In-Depth Information
'55
'59
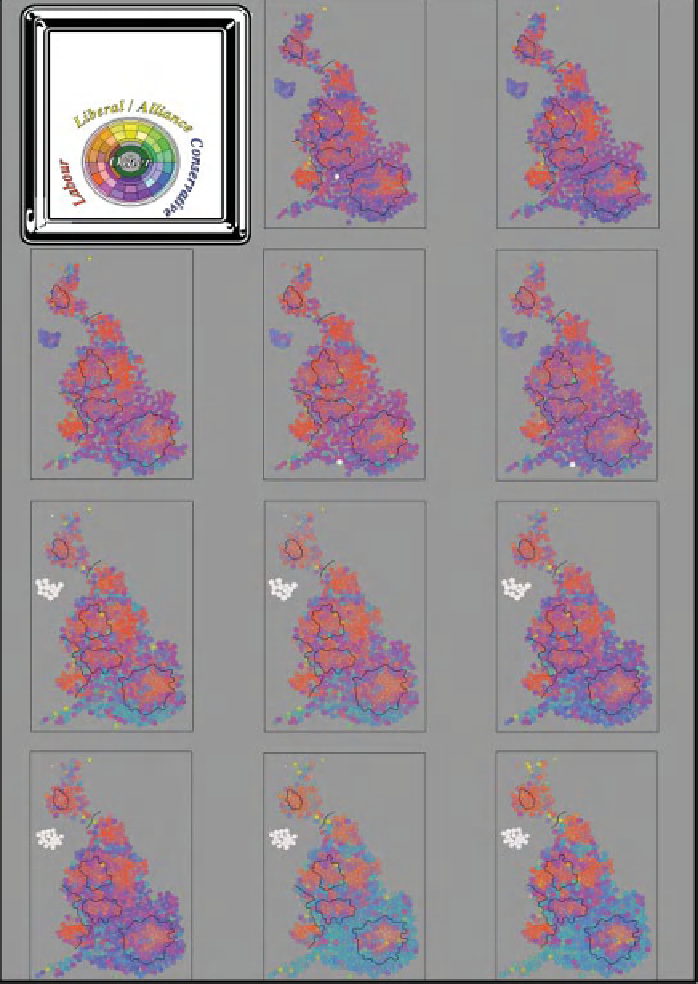
Ten British General
Elections 1955-1987
Voting Composition
by Constituency
'64
'70
'66
February
October
'74
'74
'79
adjusted
'79
'87
'83
Figure 5.17 Here each constituency is shaded to show the proportion of votes
given to each main political party. Northern Ireland goes its own way. The general
change and increasing polarisation is evident. The ring formed around the Capital
by 1987 mirrors a lot of the other distributions found in this topic. Britain was
politically a much less divided country in the 1950s.
Search WWH ::

Custom Search