Information Technology Reference
In-Depth Information
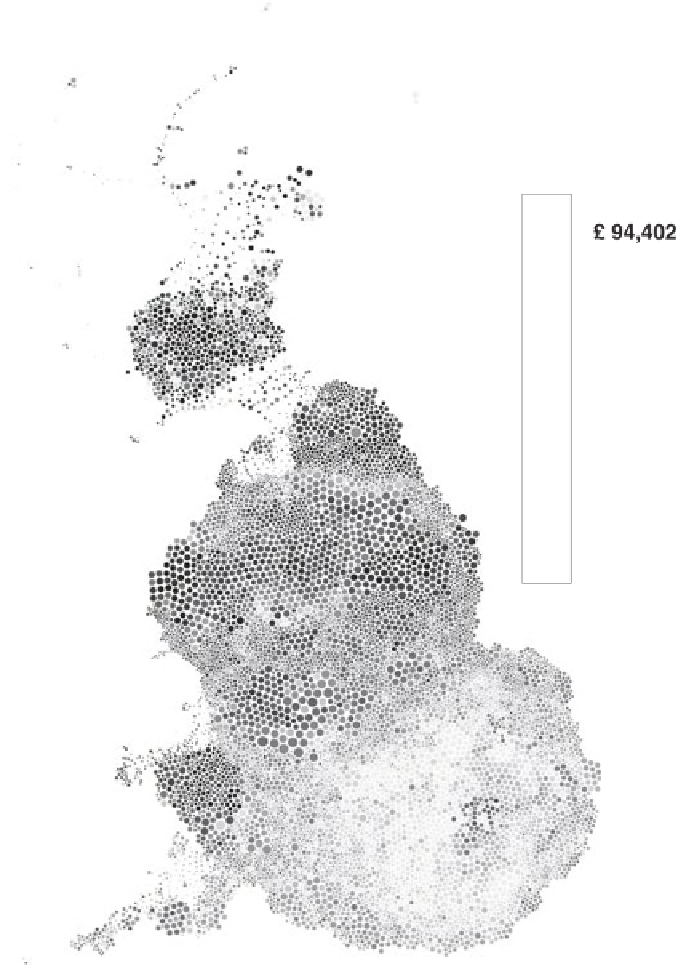
The Distribution of
Housing Price in
Britain 1989.
Continuous Mean
Price by Ward of:
Figure 5.14 This picture looks similar to that for 1983 (see Figure 4.15). Some
lowest valued wards have shifted; in London, to nearer the centre. Prices in the
centre of Aberdeen have collapsed. However, look at the scales. At the bottom end,
average ward house prices have risen by 55 %, at the top by 145 % - fortunes
paid for by people going into negative equity and later by future house buyers
and renters.


Search WWH ::

Custom Search