Information Technology Reference
In-Depth Information
The Space/Time Trend of
Unemployment in Britain, 1978-1990.
on 1981
Amalgamated
Office Area
1978
1979
1980
population
cartograms,
scale indicating
deviation from
expected levels
of unemployment.
1981
1982
1983
50% under
10% under
1984
1985
1986
0%
10% over
50% over
1987
1988
1989
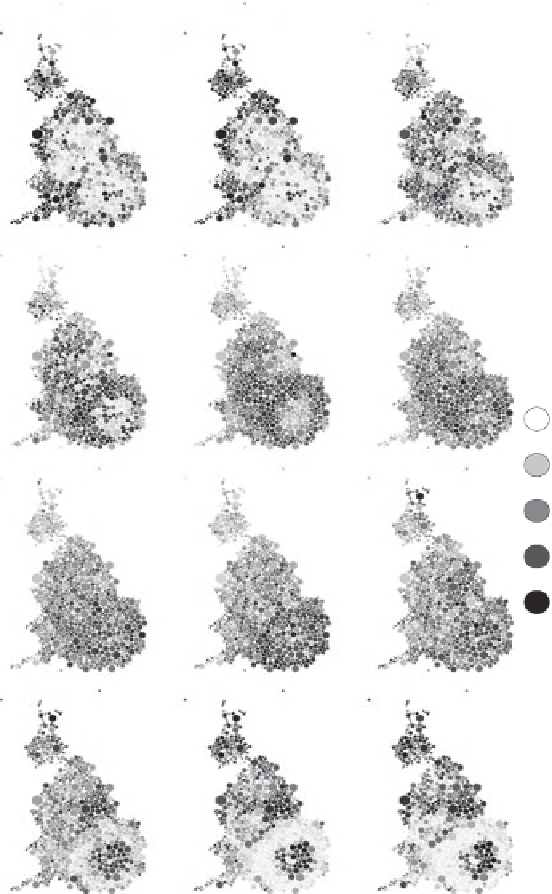
Figure 5.5 Twelve years of unemployment figures, shown using a cartogram of
the 852 amalgamated office areas. A very distinctive pattern emerges of 'Celtic
Fringe' turning into 'Inner City' decline against a backdrop of a ring of relatively
good fortune was forming around the Capital. The pattern is well defined and the
area getting worse most quickly is seen then to be central London.
Search WWH ::

Custom Search