Information Technology Reference
In-Depth Information
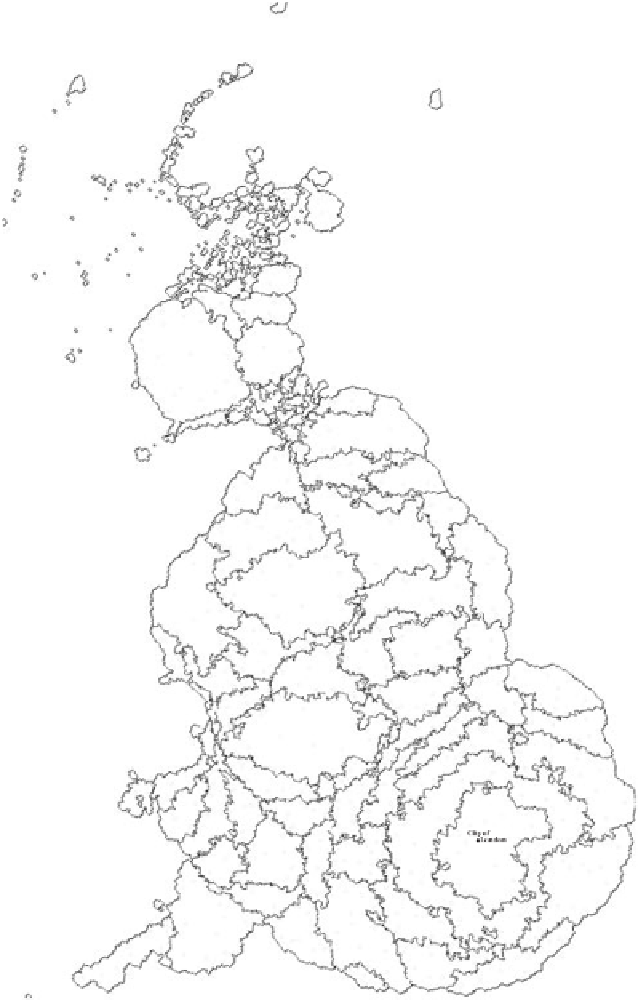
Enumeration District
Population Cartogram
Showing County and Inner
London Boundaries, with
District centres labelled.
Figure 3.16 This cartogram is the same as that just shown, based on the same
population of the 1981 census enumeration districts. County and Inner London
boundaries are shown and district centres labelled. The district names have
been rearranged by hand after application of a boundary edge-detection algo-
rithm. This diagram can be used as a key to the enumeration district cartograms
shown later.


Search WWH ::

Custom Search