Information Technology Reference
In-Depth Information
A cellular automaton algorithm was used to achieve this.
13
In this work the focus
is instead on creating the simplest population cartogram, only roughly following
the physical outline of Britain, so that the patterns are depicted with the least
visual distortion and so that the greatest internal detail can be included through
the many thousands of individual areas being shown (Figure 3.11).
The shapes of internal places in most cartograms in this topic have been made
circular (Box 3.2), and hence as simple to gauge in terms of their area/importance
as possible. Strictly speaking, the contiguity and topological constraints are now
broken, but in practice most places still bordered their former neighbours after
transformation. Various methods could be employed to make the cartogram, once
Box 3.2
The algorithm at work
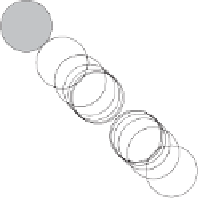
The algorithm that was developed to
create the area cartograms worked by
repeatedly applying a series of forces
to the circles representing the places.
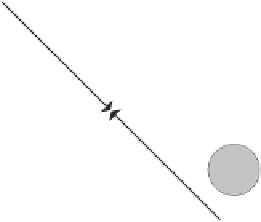
Circles attract those they are topolog-
ically adjacent to, the strength of this
attraction being greater the larger the
distance is between them and the longer
their common boundary.
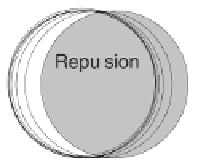
They repel those that they over-
lap, with a strength proportional to the
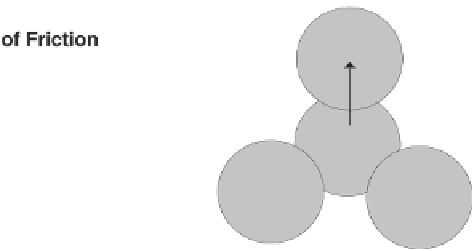
overlap. Friction is applied to prevent
unsatisfactory local solutions being set-
tled too soon. The repulsion factor must always be slightly greater than the
attraction or else (where, for example, each of four zones are all connected
to the other three) an overlap will always remain.
13
The algorithm is described in Dorling (1996).


Search WWH ::

Custom Search