Geology Reference
In-Depth Information
TEMPERATURE T/K
400
800
1000
1200
1400
1600
0
10
-10
e
R
Q
10
-20
10
-30
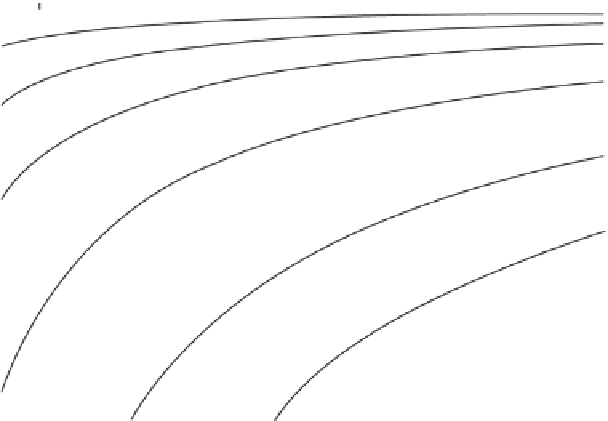
Fig. 3.1
Trends in activation rates with temperature T and activation energy Q
striking features are the rapid decrease in order of magnitude of the absolute value
and the increase in temperature sensitivity (slope) at given temperature as Q is
increased. The increase in temperature sensitivity as the temperature decreases at
fixed Q is also evident. These properties are less obvious in the usual experimental
plots of ln rat
ð Þ
versus 1
=
T
;
which give straight lines for fixed values of Q.
The pressure may also influence the rate of a process, although its effect tends
to be less marked than that of the temperature. To take the influence of pressure
into account, (
3.1
) can be rewritten in the form
rate
¼
Ae
Q
0
þ
pV
ð
3
:
2
Þ
RT
where Q
0
is the activation energy at zero or other reference pressure, p is the
pressure relative to the reference pressure, and V
is a parameter having the
dimensions of volume per unit amount of substance and known as the activation
volume; V
is commonly found to be constant for measurements over an appre-
ciable range of pressure. Again, the form (
3.2
) is supported empirically but it can
be rationalized in a similar way to that given for (
3.1
) by postulating that the
threshold level of energy for activating the elementary microscopic events must
include an amount sufficient to provide the work required for the momentary
increases in volume occurring locally during the events.
It is to be noted that, as introduced here, the activation energy Q or Q
0
þ
pV in
(
3.1
) and (
3.2
) is a kinetically rather than a thermodynamically defined quantity
and so, strictly, is not to be identified immediately with one of the thermodynamic