Biomedical Engineering Reference
In-Depth Information
d
n
4
y
3
n
g
|
1
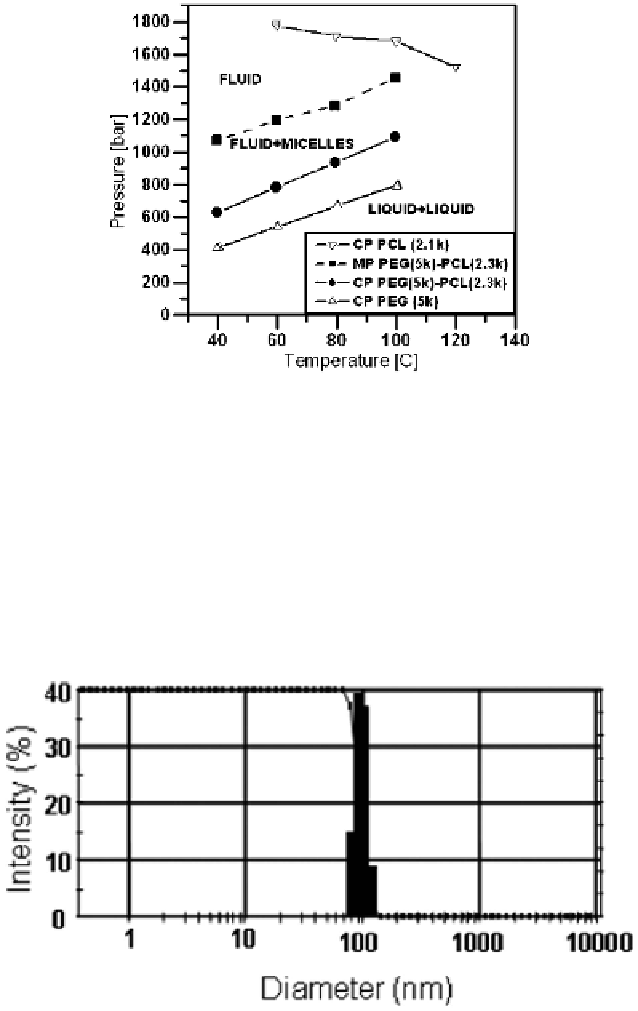
Figure 13.8
Pressure-temperature phase diagram of PEG (5k), PCL (2.3k), and the
corresponding block copolymer in near-critical trifluoromethane. The
concentrations of polymer were 1 wt% for the homopolymers and
5 wt%
al.
18
for
the
copolymer.
(Reproduced
from
Tyrrell
et
with
permission from the American Chemical Society.)
Figure 13.9
Particle size results of PEG-b-PCL (5k-b-2.3k) in water after near-
critical trifluoromethane processing (P 5 650 bar, T 5 35 uC). The
approximate concentration of polymer in water was y0.1 wt%. The
nominal
average
diameter
over
three
runs
was
101 ¡ 5nm.
(Reproduced from Tyrrell et al.
18
with permission from the American
Chemical Society.)