Biomedical Engineering Reference
In-Depth Information
d
n
4
y
3
n
g
|
8
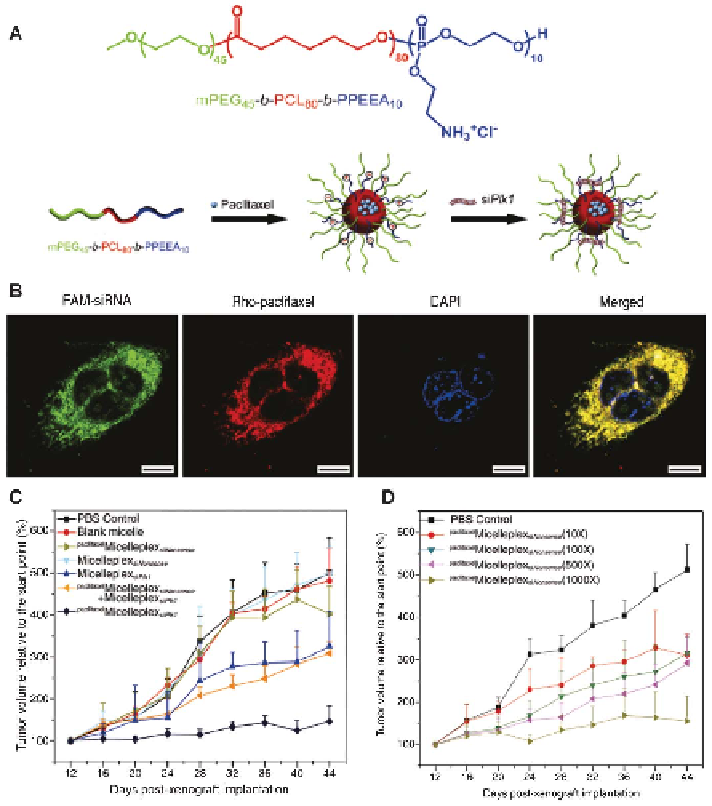
Figure 7.11
(A) The chemical structure of mPEG
45
-b-PCL
80
-b-PPEEA
10
and schematic
illustration of micellar nanoparticle formation and the loading of paclitaxel
and siRNA. (B) Confocal laser scanning microscope (CLSM) image of the
intracellular distribution of
Rho-paclitaxel
micelleplex
FAM-siRNA
in MDA-MB-
435s cells after incubation for 2 h (6306). The scale bar is 10 mm. Paclitaxel
and siRNA were labeled with rhodamine (red) and fluorescein (green),
respectively. Cell nuclei were stained with 49,6-diamidino-2-phenylindole
(DAPI; blue). (C) Inhibition of MDA-MB-435s xenograft tumor growth by
paclitaxel
micelleplex
siPlk1
in comparison with various formulations (n 5 6).
(D) Dose-response study of paclitaxel delivered by
paclitaxel
micelleplex
siNonsense
on the inhibition of MDA-MB-435s xenograft tumor growth (n 5 6).
Paclitaxel doses were 10- to 1000-fold higher (106 to 10006) compared
to those used in the
paclitaxel
micelleplex
siPlk1
. (Adapted from Sun et al.
123
with permission from the American Chemical Society.)