Biomedical Engineering Reference
In-Depth Information
e.g., cardiac activity. The main advantage of recurrence plots is that they provide
information even for short and non-stationary data, where other non-linear methods
fail.
2.5.5
Poincar´emap
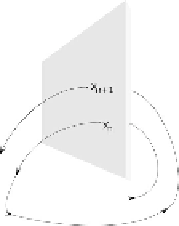
FIGURE 2.24:
Construction of the Poincare map. The Poincare map relates two
consecutive intersection points
x
n
+
1
and
x
n
, which come from the same side of the
plane.
Another way to visualize the dynamical system evolution in a phase space is a
Poincare map. A Poincare section is the intersection of a trajectory of a dynamical
system in the state space with a certain lower dimensional subspace, transversal to
the flow of the system. The Poincare map relates two consecutive intersection points
x
n
+
1
and
x
n
, which come from the same side of the plane (Figure 2.24). A Poincare
map differs from a recurrence plot because it is defined in a phase space, while a
recurrence plot is defined in a time space (points on this plot depict pairs of time
moments when the system visits roughly the same region of phase space). By means
of the Poincare map it is possible to reduce the phase space dimensionality, at the
same time turning the continuous time flow into a discrete time map [Kantz and
Schreiber, 2000].
2.5.6 Approximate and sample entropy
Even for low-dimensional chaotic systems, a huge number of points is required to
achieve convergence of the algorithms estimating dimension or entropy of the pro-
cess. In order to overcome this difficulty and provide a measure capable of quantify-
ing the changes of process complexity the modifications of the entropy measure were
proposed. Approximate entropy (ApEn) was introduced by [Pincus, 1991]. ApEn
measures the (logarithmic) likelihood that trajectories that are close to each other
remain close on the next incremental comparison. However, methodological pitfalls


Search WWH ::

Custom Search