Biomedical Engineering Reference
In-Depth Information
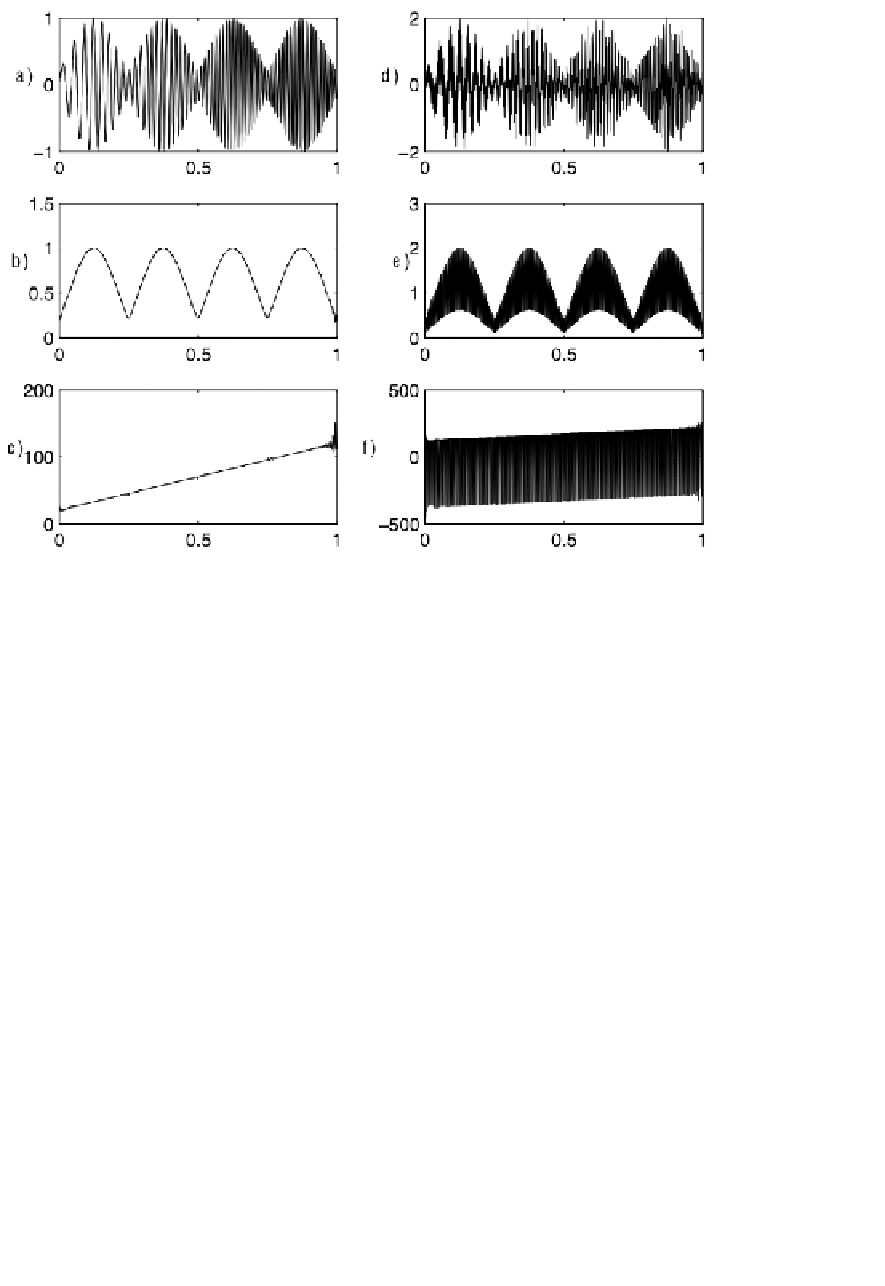
FIGURE 2.12:
Instantaneous amplitude and frequency. a) Signal: modulated lin-
ear chirp; b) instantaneous amplitude of signal in panel (a); c) instantaneous fre-
quency of signal in panel (a); d) signal composed of two modulated linear chirps
with the same slope as in (a) but different intercept frequency; e) instantaneous am-
plitude of signal in panel (d); f) instantaneous frequency of signal in panel (d).
2. The marginal distributions are conserved:
Z
∞
2
ρ
x
(
t
,
f
)
dt
=
|
X
(
f
)
|
(2.69)
−
∞
Z
∞
2
ρ
x
(
t
,
f
)
df
=
|
x
(
t
)
|
(2.70)
−
∞
Convenient MATLAB toolbox for analysis of signals in time-frequency domain is
nongnu.org/
2.4.2.1.1 Wigner-Ville distribution
The basic time-frequency energy density
distribution is the Wigner-Ville distribution (WVD) defined as (for signals repre-
sented in time domain):
Z
∞
x
∗
(
e
−
i
2π
f
τ
d
τ
W
x
(
t
,
f
)=
x
(
t
+
τ
/
2
)
t
−
τ
/
2
)
(2.71)
−
∞


Search WWH ::

Custom Search