Biomedical Engineering Reference
In-Depth Information
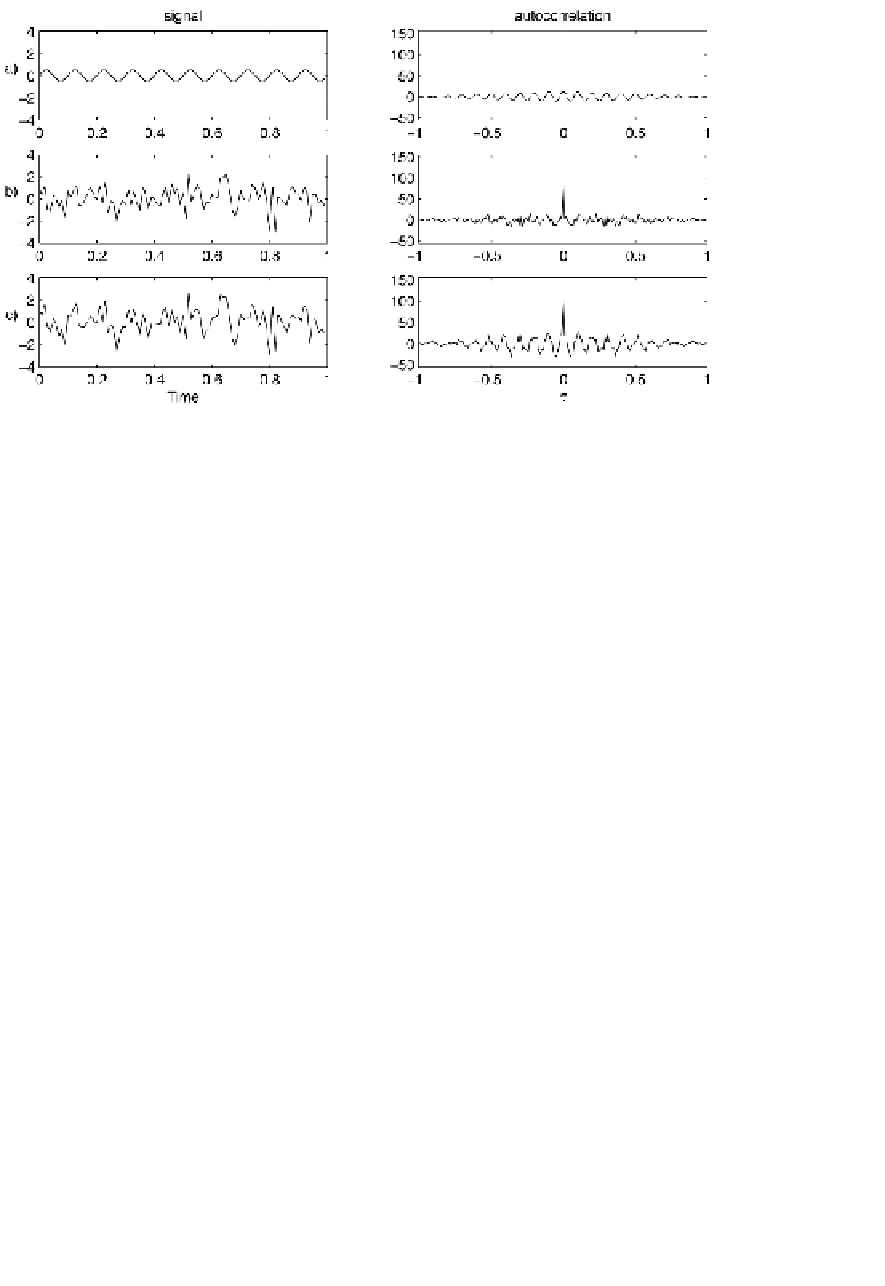
FIGURE 2.4:
Illustration of autocorrelation function properties. Left column sig-
nals, right column autocorrelation functions of the corresponding signals. a) Periodic
signal, b) zero mean Gaussian noise, c) sum of a) and b).
2.3.2
Analytic tools in the frequency domain
2.3.2.1
Estimators of spectral power density based on Fourier transform
In physiological signals quite often important information is connected with the
occurrence of specific rhythms; therefore the analysis in frequency domain is of par-
ticular interest. A commonly used method of estimation of the power spectrum
S
(
f
)
is based on the Fourier transform:
X
∗
(
S
(
f
)=
X
(
f
)
f
)
(2.32)
X
(
f
)
is the Fourier transform of the signal
s
(
t
)
defined by equation (1.27), where
Fourier transform is defined for times
. Fourier transform for the sam-
pled signal and for finite time of observation is expressed by formula (1.28), derived
under the assumption that the signal given in the time window, outside it, is period-
ically repeated to infinity
(Figure 2.5)
.
In practice, taking the finite segment of the
signal for
t
∈
(
−
∞
,
+
∞
)
∈
(
−
T
/
2
,
T
/
2
)
is equivalent to multiplication of the signal by a function
w
:
⎧
⎨
0for
t
< −
T
/
2
w
T
/
2
(
t
)=
w
for
−
T
/
2
≤
t
≤
T
/
2
(2.33)
⎩
0for
t
>
T
/
2
where
w
1. This procedure introduces discontinuities at the edges of the window
which disturb the spectrum. The discontinuities contribute to the spectrum at many
frequencies, causing an effect known as spectral leakage. Multiplication in the time
=


Search WWH ::

Custom Search