Biomedical Engineering Reference
In-Depth Information
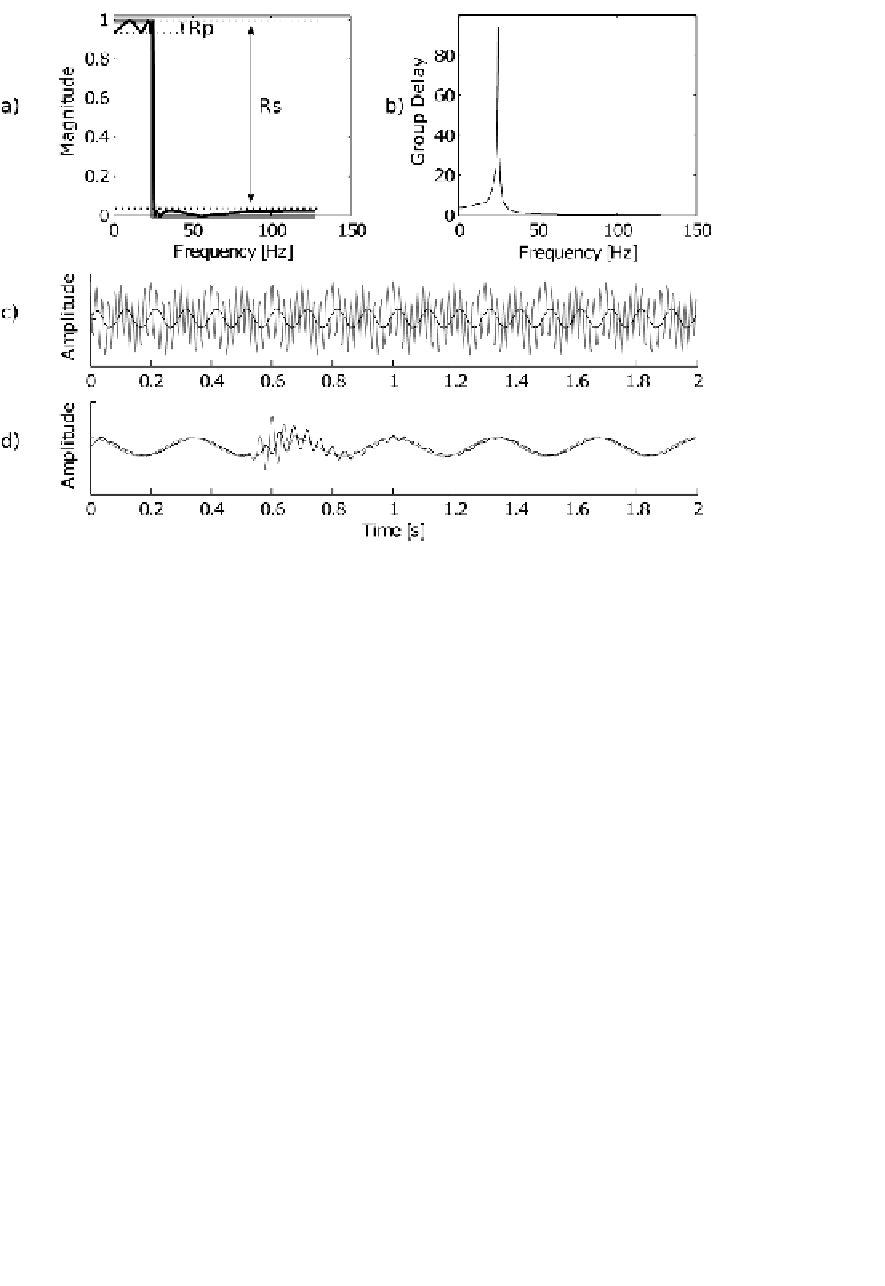
FIGURE 2.1:
Illustration of filter properties. a) Magnitude of frequency response
function. Gray rectangular outline—the ideal response, black—the magnitude of the
designed elliptic 5
th
order filter. Arrows indicate allowed passband ripples (Rp) and
required minimum attenuation in the stop band (Rs). b) Group delay function. c)
Application of the designed filter to a signal composed of a 10 Hz and 50 Hz sinusoid:
input—gray, output—black line. d) Illustration of the delay and the edge effects of
the filter: the input signal (gray) is a 3 Hz sinusoid with a 25 Hz transient at 0.6 s;
the output black line shows (i) in the first 0.1 s an edge distortion of the filter (ii)
delays: the output 3 Hz sinusoid is delayed slightly compared to the input; the 25 Hz
transient is more delayed and spread, which follows from the characteristics of the
group delay function (b).
2.1.2 Changing the sampling frequency
In previous sections we described the main field of filter applications—the se-
lection of relevant frequency bands from the signals and suppression of unwanted
frequency bands. Here, we would like to mention one more application where the
filters are indispensable: the process of resampling the signal at another sampling
frequency. Let's imagine that we need to reduce the sampling frequency (
downsam-
ple
) of the signal by half. The simplest idea could be skipping every other sample
in the original signal. However in most cases this would spoil the signal due to the
aliasing (see Sect. 1.2.1.1). In order to do it properly, one needs to take care that the
assumption of sampling theorem (Sect. 1.2.1) is fullfiled; that is, the signal contains


Search WWH ::

Custom Search