Biomedical Engineering Reference
In-Depth Information
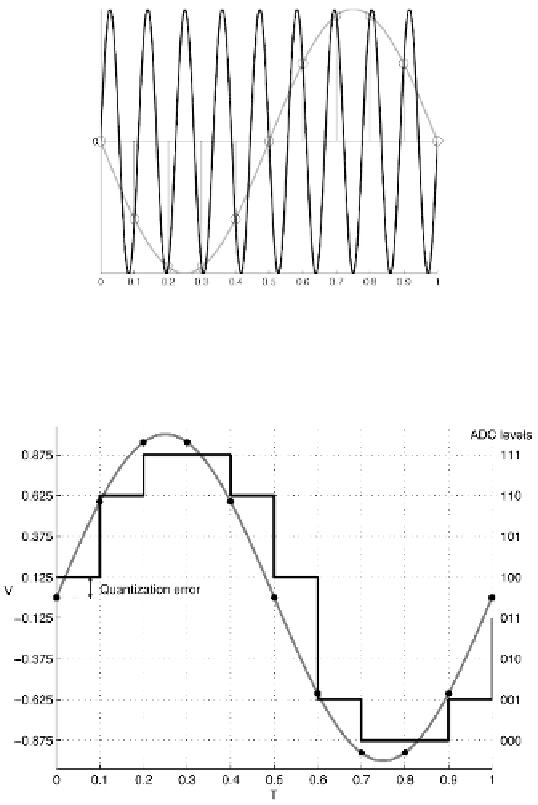
FIGURE 1.2:
Illustration of the aliasing effect. Samples taken every 0.1 s from
a 9 Hz sinusoid (black) are exactly the same as these taken from the 1 Hz sinusoid
(gray).
FIGURE 1.3:
Illustration of the quantization error for a 3 bit ADC. The digitized
representation (black line) of the continuous sinusoid (gray line). The range of 2 [V]
is divided into 8 levels. The sampled signal values (black dots) are rounded to the
nearest ADC level.
so that
±
200
μV
covers the full range of a 12 bit ADC. This range is divided into bins
2
12
of 400
/
=
400
/
4096
≈
0
.
1
μV
. It means that we measure the amplitude of the
signal with precession
±
0
.
05
μV
.


Search WWH ::

Custom Search