Biomedical Engineering Reference
In-Depth Information
the determination of the frequency-latency dependence [Jedrzejczak et al., 2004]
and found application for evaluation of the influence of an exposition of subjects to
noise [Jedrzejczak et al., 2005].
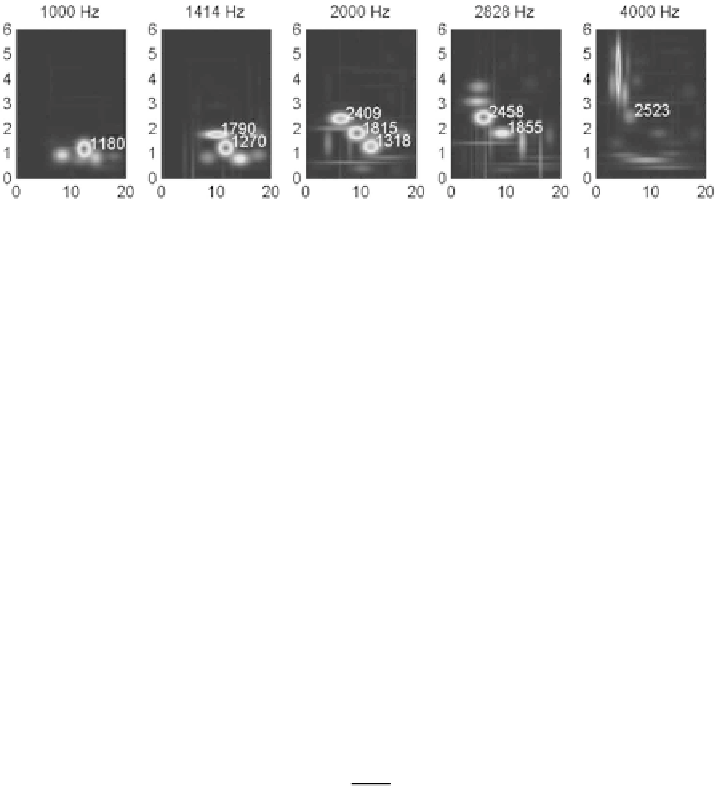
FIGURE 4.62: (SEE COLOR INSERT)
Time-frequency energy distribution of
OAE obtained for tonal stimulation of frequencies shown above the pictures. The
same resonance modes are excited by tonal stimuli of different frequencies.
One of the parameters returned by MP is a time span of a component. It was
observed that the histogram of time spans of TEOA components is bimodal [Jedrze-
jczak et al., 2004] and that long lasting components have a very narrow frequency
band and do not obey exponential frequency-latency dependence. This kind of obser-
vation indicated that they are connected with SOAEs. The application of MP allowed
for differentiation of TEOAE components into short and long lasting ones connected
with SOAEs [Jedrzejczak et al., 2008] and explanation of paradoxically longer la-
tencies found for pre-term neonates [Jedrzejczak et al., 2007].
Closer inspection of OAE components revealed that some of them, especially the
long lasting ones, have an asymmetric shape. In order to better approximate the sig-
nal, asymmetric basic functions were introduced to the MP dictionary [Jedrzejczak
et al., 2009]. These functions are composed of two parts; the first is based on Gabor,
and the second on an exponential function. This kind of waveform can have different
rise and fall times for the same frequency. Such a waveform can be described by the
formula:
N
e
−
(
t
−
μ
)
2
cos
for
t
≤
T
f
2σ
2
Λ
(
t
;
μ
,
σ
,
ω
,
φ
,
T
f
)=
(
ω
t
+
φ
)
(4.47)
e
−
α
(
t
−
τ
)
for
t
>
T
f
T
f
−
μ
T
f
+
μ
whereα
μ
determines the asym-
metry of the atom.
T
f
describes the point at which the Gaussian envelope changes
into an exponential decay function. The function thus obtained is continuous up to
the first-order derivative.
Introduction of enriched dictionary encompassing asymmetric functions resulted
in a better time resolution of time-frequency distributions of signal energy. In Figure
=
andτ
=
. The additional parameter
T
f
>
σ
2
2


Search WWH ::

Custom Search