Biomedical Engineering Reference
In-Depth Information
ysis of matching pursuit [Jedrzejczak et al., 2004]. Matching pursuit decomposes sig-
nals into components of specific amplitudes, frequencies, latencies, and time spans,
so these parameters are given explicitly. A comparison of different methods used
for OAE analysis is shown in Figure 4.61. The simulated signal used for testing the
methods was constructed from the so-called gammatones—the functions resembling
the shape of click evoked OAE at single resonant frequency. The gammatone is ex-
pressed by a function, whose envelope rises as
t
3
and decays exponentially with a
constant Γ:
γ
0
t
3
e
−
2πΓ
t
sin
(
)=
(
)
γ
t
2π
ft
(4.46)
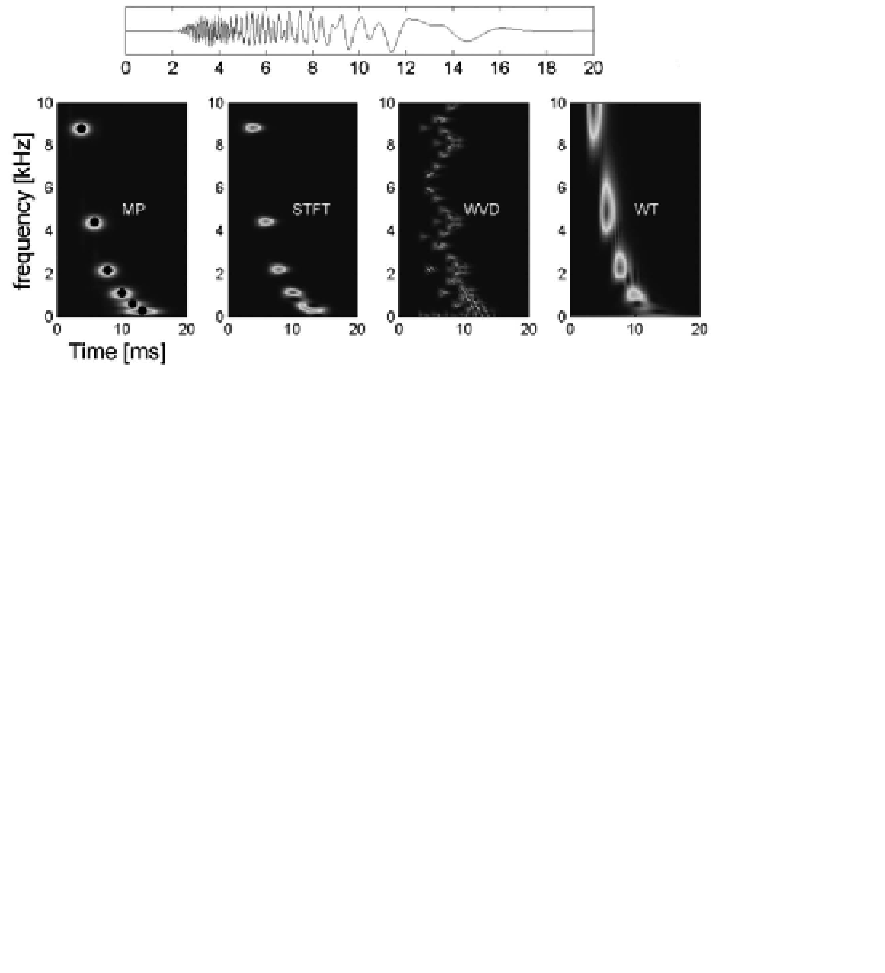
FIGURE 4.61: (SEE COLOR INSERT)
Time-frequency energy distributions
obtained by means of different methods (named on pictures) for simulated signal
(shown above) consisting of six gamma tones of frequencies 280, 550, 1100, 2200,
4400, 8800 Hz.
The test signal was constructed from six gammatones of different frequencies
(given in the legend to Figure 4.61). From Figure 4.61 it is easy to see that the com-
ponents are best recognized by the MP method. Performance of a spectrogram is
also quite good but two components of lowest frequencies are not distinguished. The
additional advantage of MP is the parametric description of the components.
The MP method allowed for identification of the resonant modes of the OAE,
which are characteristic for each ear [Jedrzejczak et al., 2004, Jedrzejczak et al.,
2006]. It was found that in case of tonal stimulation the ear does not respond in
the frequency of stimulus, but several resonant modes are excited (different in left
and right ear). Those closest to the stimulation frequency have the highest amplitude
(Figure 4.62).
The explicit identification of the latency of components allowed for


Search WWH ::

Custom Search