Biomedical Engineering Reference
In-Depth Information
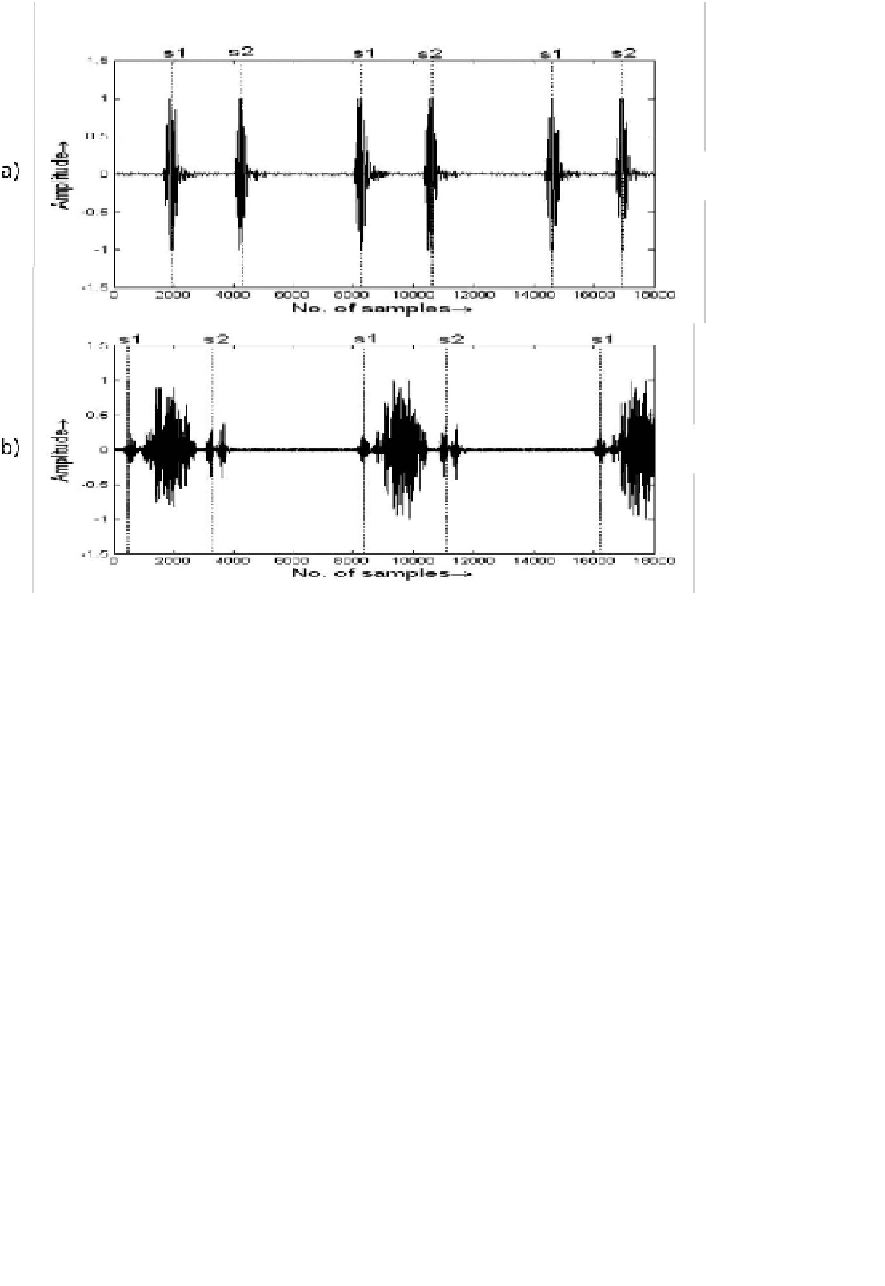
FIGURE 4.59:
PCG signal a) for normal subject, b) for subject with pulmonary
stenosis. Sampling frequency 8012 Hz. Adapted from [Ari et al., 2008].
which was then analyzed by means of the AR model of the order 2. The approach
proved effective in delineating a set of clinically diagnosed systolic murmurs.
For evaluation of the condition of bioprosthethic valves, features of the power
spectrum such as the location of maximum peak have been used to indicate whether
the valve is normal or abnormal. For example, changes in the frequency content of
PCGs from bioprosthetic valves were described by [Stein et al., 1981], who reported
that the PCG of an abnormal valve has more high-frequency content than that of
a normal valve, and in patients with mitral bioprotheses, implanted five years or
longer, the higher frequencies have a greater proportion of sound energy compared
to patients with implants of less than 1.5 years. These findings were based on the
power spectra computed by means of Fourier transform. Joo and coworkers [Joo
et al., 1983] reported that more accurate description of heart sounds in patients with
a bioprosthetic heart valve may be obtained by a pole-zero model based on ARMA
formalism.
In the study of performance of a heart valve implanted in the mitral position AR
model was used by [Koymen et al., 1987]. The authors applied an approach similar to


Search WWH ::

Custom Search