Biomedical Engineering Reference
In-Depth Information
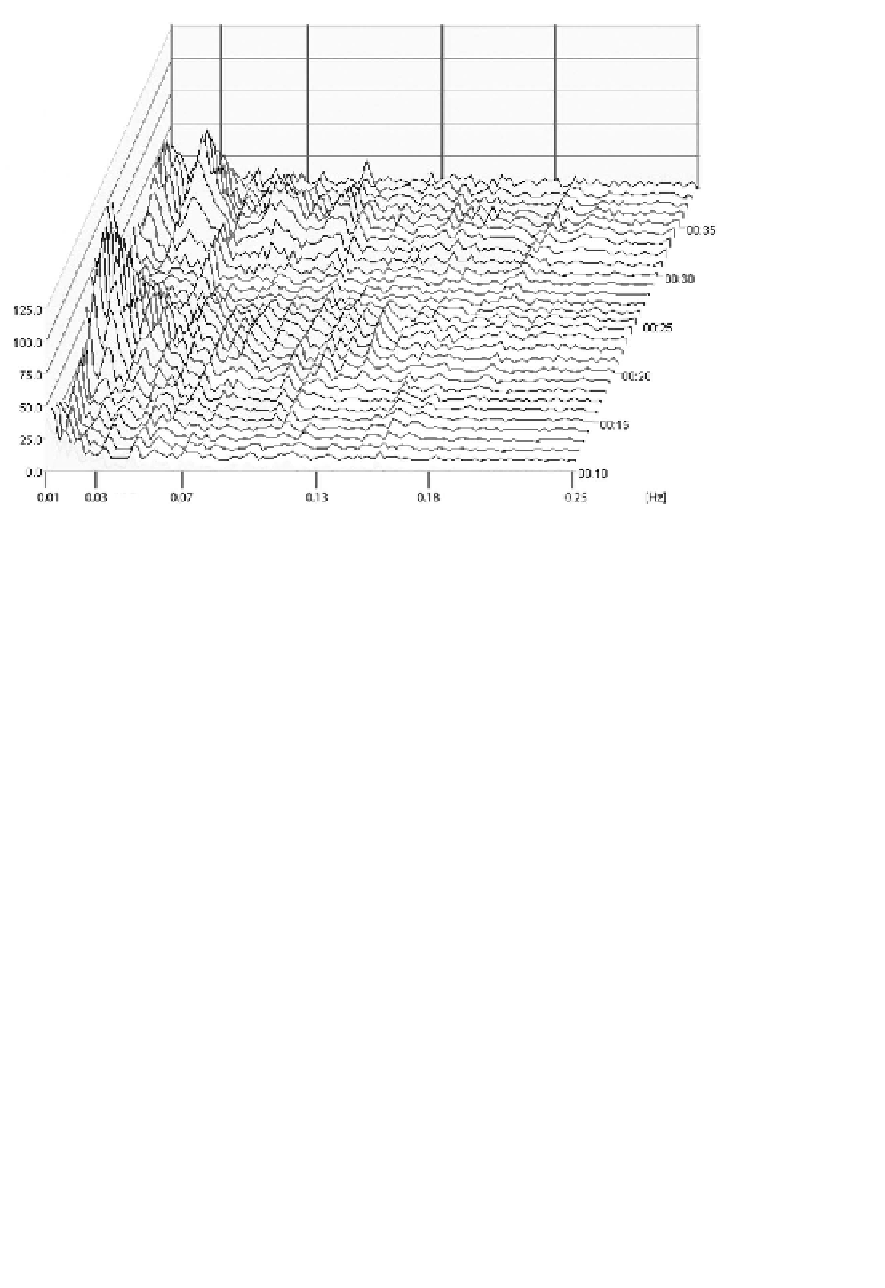
FIGURE 4.58:
Power spectra showing rhythms of different parts of gastro-
intestinal tract (marked on horizontal scale) and their evolution in time (oblique axis).
On vertical axis, amplitude in
μ
V.
positions, recording periods, test meals, methods of analysis, and normal reference
diminishes the significance of EEnG in diagnosis of gastro-intestinal tract dysfunc-
tions. Another obstacle is a low signal to noise ratio of EEnG, which is contaminated
by respiration, ECG signal, movement artifacts, and other types of interference. The
amelioration of the methods of EEnG processing together with standardization of
procedures is a prerequisite for the broader application of this signal in medical di-
agnosis of gastro-intestinal disorders.
The most common method of EEnG evaluation is spectral analysis. From spec-
tra the parameters characterizing the power in different frequency bands connected
with activity of corresponding parts of the gastro-intestinal tract may be found. The
dynamics of EEnG was usually estimated by means of STFT [van der Schee and
Grashius, 1987, Pfister et al., 1988]. Discrete wavelet analysis was used in [Tok-
makci, 2007] for evaluation of EGG from normal and diabetic gastroparetic subjects.
In this study Daubechies db3 wavelets from the MathWorks MATLAB were used for
three level decomposition. The detail coefficients were considered by the author as a
noise and the analysis was conducted for three approximation coefficients: A1, A2,
A3. Paired samples
t
-test reported (uncorrected) p-values below a 5% difference be-
tween the normal and pathological group for parameters: minimum values of A1,
A2, A3, and for mean values of power spectral density obtained from these coeffi-


Search WWH ::

Custom Search