Biomedical Engineering Reference
In-Depth Information
same study the fragmentation of the R peak of MCG and distinct contributions of
more than one dipole in the contour maps was observed for several subjects, which
didn't show distinct changes in ECG. It was postulated that the fragmentation of R
peak of MCG was connected with altered ventricular depolarization. In the several
investigated cases the MCG has revealed more distinct features connected with the
disturbances in the heart action than ECG, which opens the possibility to improve
the ability of early detection of myocardial infarction by means of MCG.
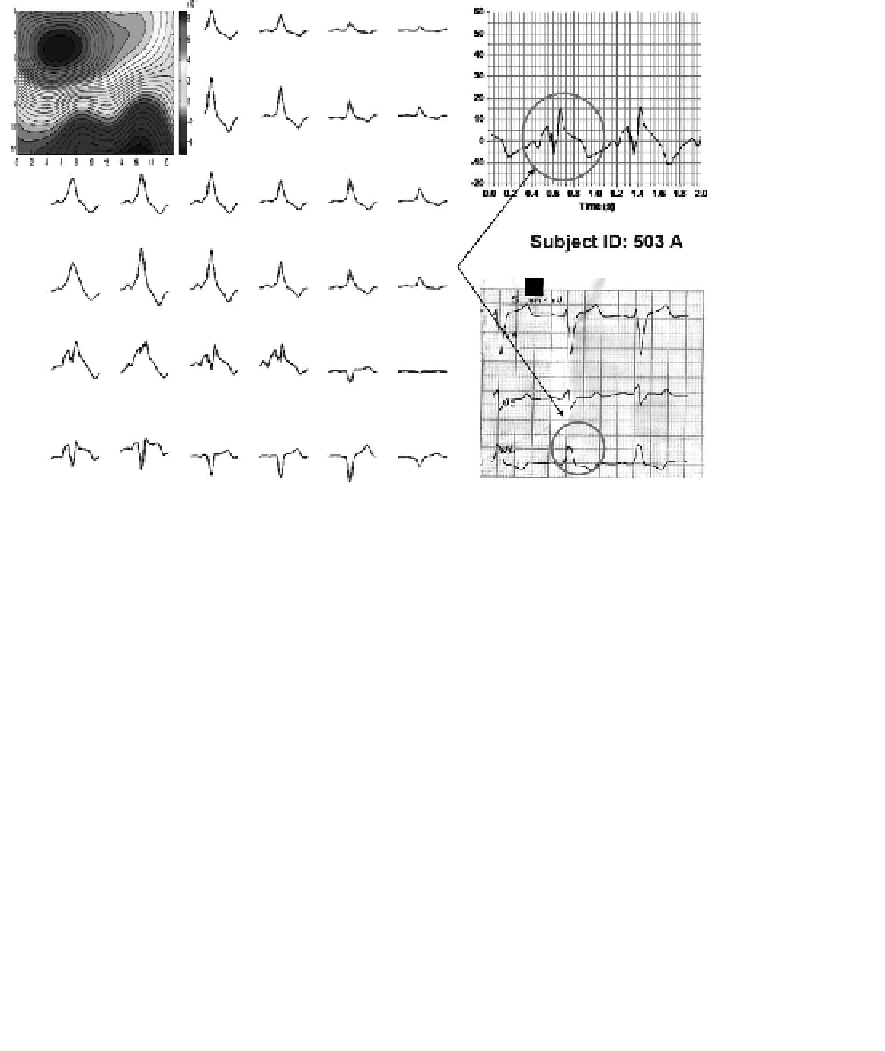
FIGURE 4.44:
Averaged MCG at the spatial positions recorded over the chest.
The top left panel is the corresponding magnetic field map. The ECG at lead V6
showing features of left bundle branch block (highlighted with a circle) is at bottom
right. The inset at the top right shows the time trace of two cardiac cycles in MCG
at a position above V4 of ECG. The split in the R wave is highlighted with a cir-
cle. From K. Gireesan, C. Sengottuvel, C. Parsakthi, P. Rajesh, M. Janawadkar, T.
Radhakrishnan: Magnetocardiography study of cardiac anomalies, in Selma Supek,
Ana Susac (Eds.):
Advances in Biomagnetism BIOMAG2010, IFMBE Proceedings
28, 2010, pp. 431435, Figure: 1,
www.springerlink.com/ifmbe
c
International Fed-
eration for Medical and Biological Engineering 2010. (This figure is courtesy of
IFMBE.)
The utility of the cardiac field mapping for the detection of coronary artery disease
was studied in [Grapelyuk et al., 2010]. The comparison of the results with the ideal


Search WWH ::

Custom Search