Biomedical Engineering Reference
In-Depth Information
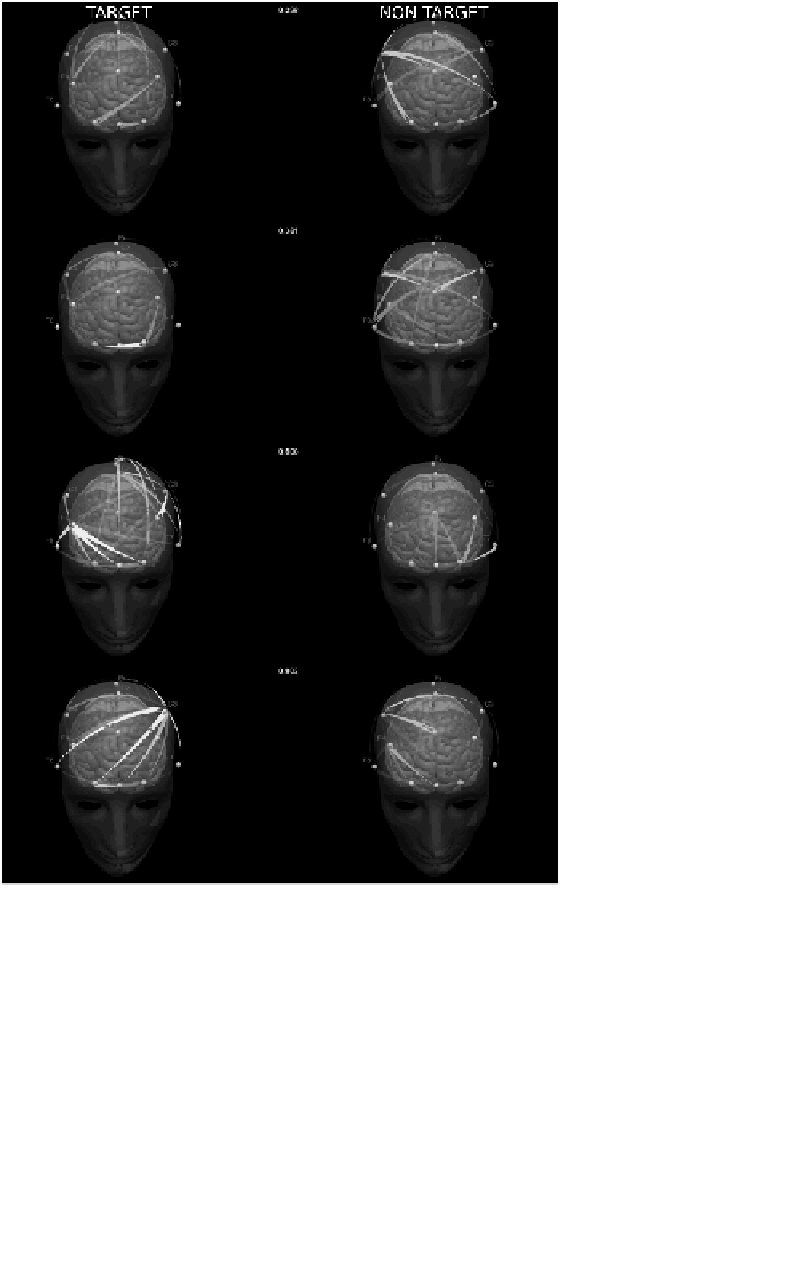
FIGURE 4.23: (SEE COLOR INSERT)
The snapshots from the animation rep-
resenting the significant changes of propagation during the CAT test obtained by
SDTF. Red and yellow arrows—increase of propagation, blue—decrease of propa-
gation. At the right—target; at the left—non-target. In the middle—time after the
stimulus in seconds. Please note in the non-target case at 0.381 s strong increase of
propagation F8
C3 connected with active inhibition of movement; and in the case
of target, at 0.803 s, propagation from C3 connected with command to move the
finger.
→


Search WWH ::

Custom Search