Database Reference
In-Depth Information
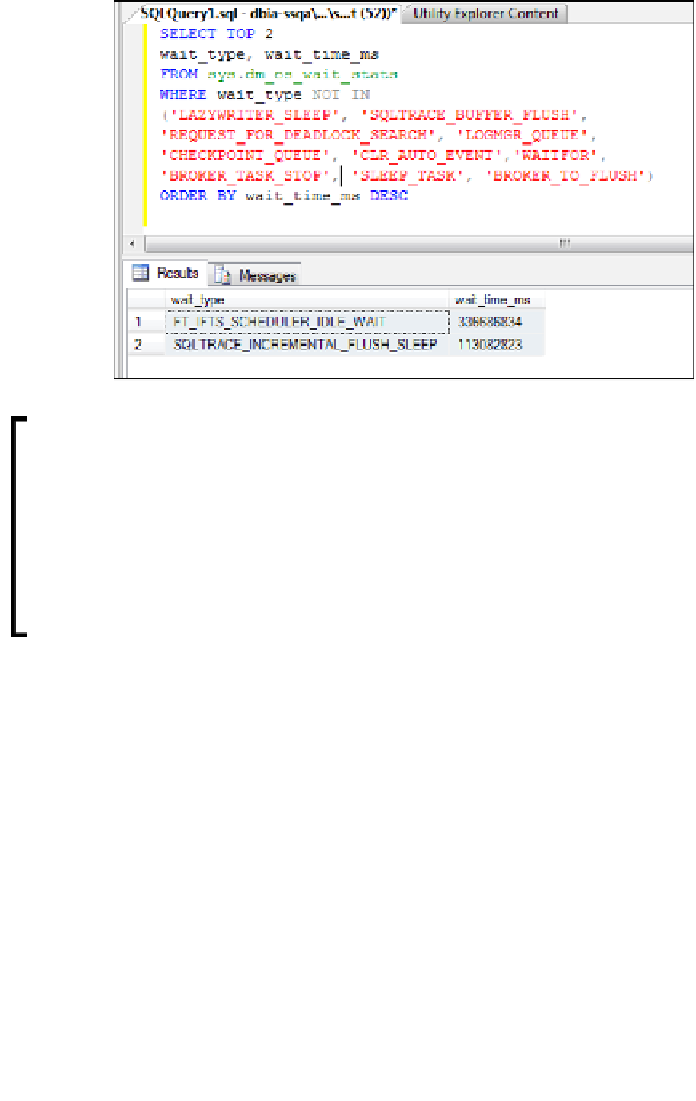
The resource usage information on 'threads' and 'waits' is obtained using
sys.dm_os_wait_
stats
DMV. The results will be as shown in the following screenshot:
Similar information can be obtained using SSMS dashboard reports on
server-scope and database-scope. For instance, on server-scope, we can
refer to Performance | Batch Execution Statistics or Performance | Top
queries by Average CPU. On database-scope, refer to Resource Locking
Statistics by Objects and Object Execution Statistics.
As a part of baseline and benchmarking strategy, the historic information
for query statistics and resource usage can be obtained using
Management Data Warehouse (MDW) | Data collector:Server Activity
and Query Statistics report.
From the results, the two wait types are presented,
FT_IFTS_SCHEDULER_IDLE_WAIT
which
is used as a background task process by full-text search requests which indicates it is waiting
for work to do.
At this point in time, we can safely ignore the outcome unless there are complaints from the
users about application search functionality, which uses Full-text search service. Further
information on detailed information and interpretation of these wait types can be obtained
from SQL Server Books Online that are published by Microsoft. The results from
sys.dm_os_
wait_stats
DMV produces another wait type
SQLTRACE_INCREMENTAL_FLUSH_SLEEP
value, which indicates the internal trace, SQL trace or PROFILER process with a high value in
number, which can be related to corresponding I/O problems on the server.


Search WWH ::

Custom Search