Database Reference
In-Depth Information
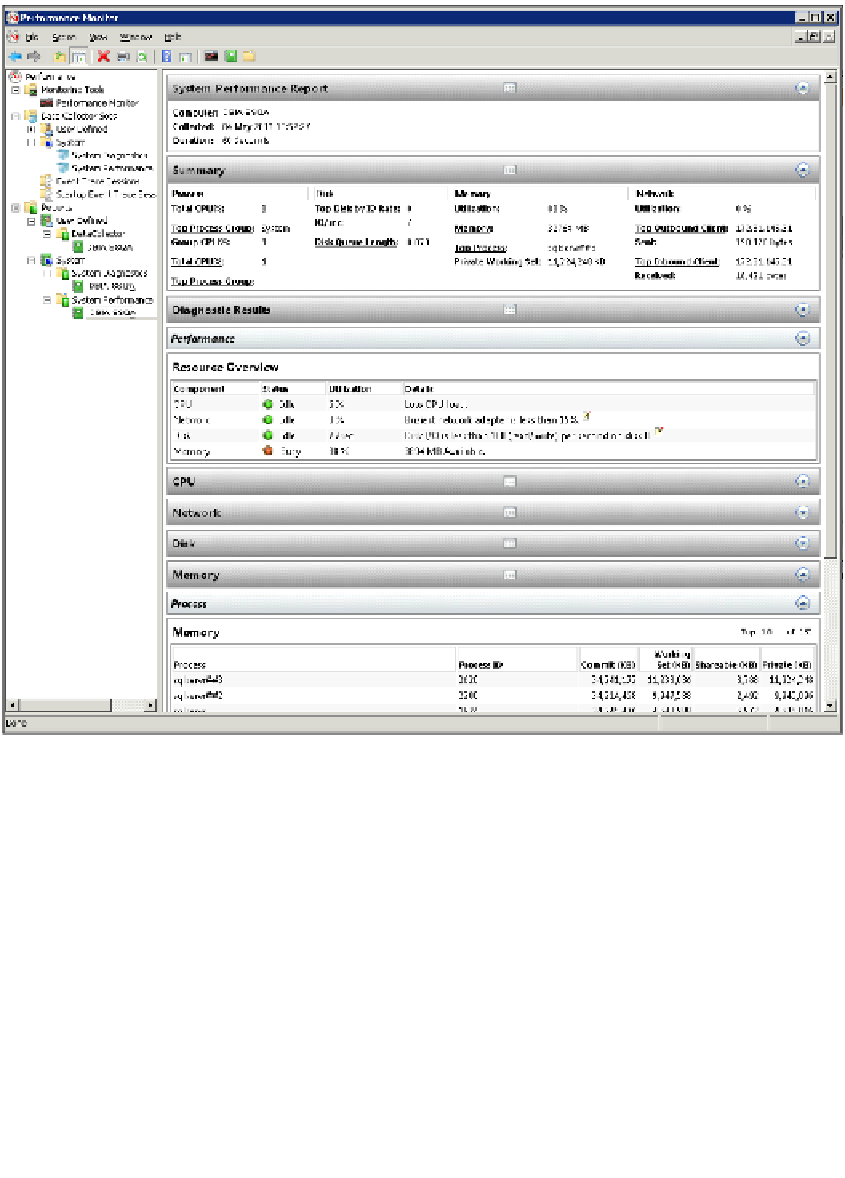
21. Open the SQL Profiler tool.
22. To collect SQL Profiler data, on the SSMS window click on Tools and select
SQL Profiler.
23. On the File menu, point to New and then click Trace.
24. Make sure that the All Event Classes and the All Data Columns options are selected.
Click OK to create a new trace.
25. On the General tab, specify a trace name and select Table to capture the data. On
the Events tab, add the following event types to your trace:
Exec Prepared SQL
Execution Plan
Missing Column Statistics
SP: Recompile
Search WWH ::

Custom Search