Environmental Engineering Reference
In-Depth Information
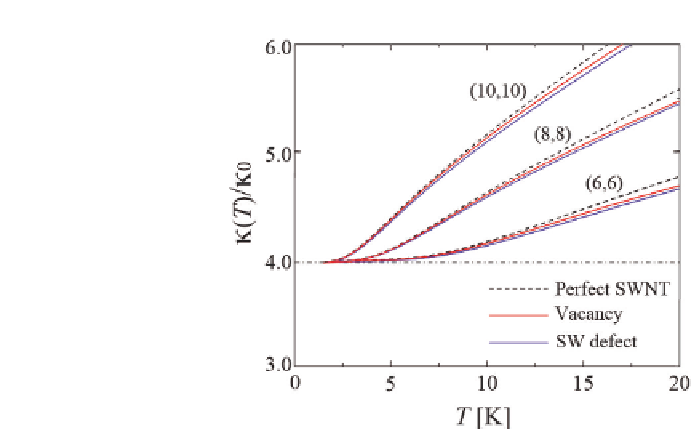
Figure 2.7
Low-temperature thermal conductances in (6,6), (8,8), and
(10,10)SWNTs.Redandbluecurvesrepresent
κ
(
T
)/
κ
0
fortheSWNTswith
the vacancy and SW defect, respectively. The dashed curves are for the
perfect SWNT.
κ
0
at cryostatic temperatures even when the CNTs
include asmall amount ofdefects (Fig. 2.7).
The transmission function
ζ
vac
(
ω
) shows many dips. These dips
can be classified into two groups by the origin of dip appearance.
One is related to the van Hove singularity points where the density
of states (DOS) of phonons diverges: these points are located at
the top and bottom of phonon dispersion branches. Because the
scattering rate is almost proportional to the DOS according to
Fermi'sgoldenrule,thetransmissiondecreasesaroundthevanHove
singularity. The positions of the other group of dips, for example,
the dip at 11.6 meV indicated by the red arrow, coincide with the
peaks in the local density of states (LDOS) around the vacancy (not
shown). The appearance of the LDOS peaks means that the phonon
densityishighlylocalizedaroundthevacancy.Thetransmissiondips
arise from the scattering of incident phonons from the lead by the
phonon localized states. The bottom-right inset in Fig. 2.6 shows
the phonon density around the vacancy at 11.6 meV indicated by
the red arrow in Fig. 2.6. The LDOS peak at 11.6 meV is located at
CNTs exhibits 4